Understanding Tableau Pulse
Tableau Pulse is a feature designed to monitor and highlight changes in data trends over time. It employs dynamic visualizations to emphasize significant fluctuations or anomalies within datasets. This real-time monitoring capability enables users to stay ahead of evolving trends and make informed decisions accordingly.
One of the key strengths of Tableau Pulse lies in its user-friendly interface , which allows for intuitive exploration of temporal data patterns. Users can easily identify spikes, dips, or trends, facilitating deeper insights into the underlying dynamics of their data.
Exploring Power BI Key Influencers
In contrast, Power BI Key Influencers focuses on identifying the key drivers or influencers behind specific outcomes or metrics within a dataset. Powered by advanced machine learning algorithms, it analyses the relationships between various data attributes to pinpoint the most influential factors.
The primary advantage of Power BI Key Influencers lies in its ability to uncover hidden correlations and dependencies within complex datasets by identifying the most important factors. Whether it's understanding customer preferences, predicting market trends, or optimizing advertising campaigns, Power BI Key Influencers can give valuable insights into the underlying drivers of business performance.
Demo Case
To gain insights into the operational mechanics of both features, I created a fake dataset (with the current year included) with the following fields:
Salary: The salary of the individual
Loan: This shows the money the individual borrowed from the bank.
Age: The age of the individual
Gender: This is whether someone is male, female, or identifies differently. This can help identify differences in salary, loan, and experiences among different groups of people.
Remaining Debt: This is how much money the individual still owes on a loan or credit.
Industry: This is the industry the individual works in.
Interest Rate: This is the percentage charged by the bank for borrowing money.
Date: This is the specific calendar day or time period when something happened or was recorded. I made sure to include the year 2024 because otherwise Tableau Pulse wouldn’t work.
The primary objective was to analyze the average salary based on gender with both Tableau Pulse and Key Influencers.
Tableau Pulse findings
Please find the Tableau Pulse demo in this video:
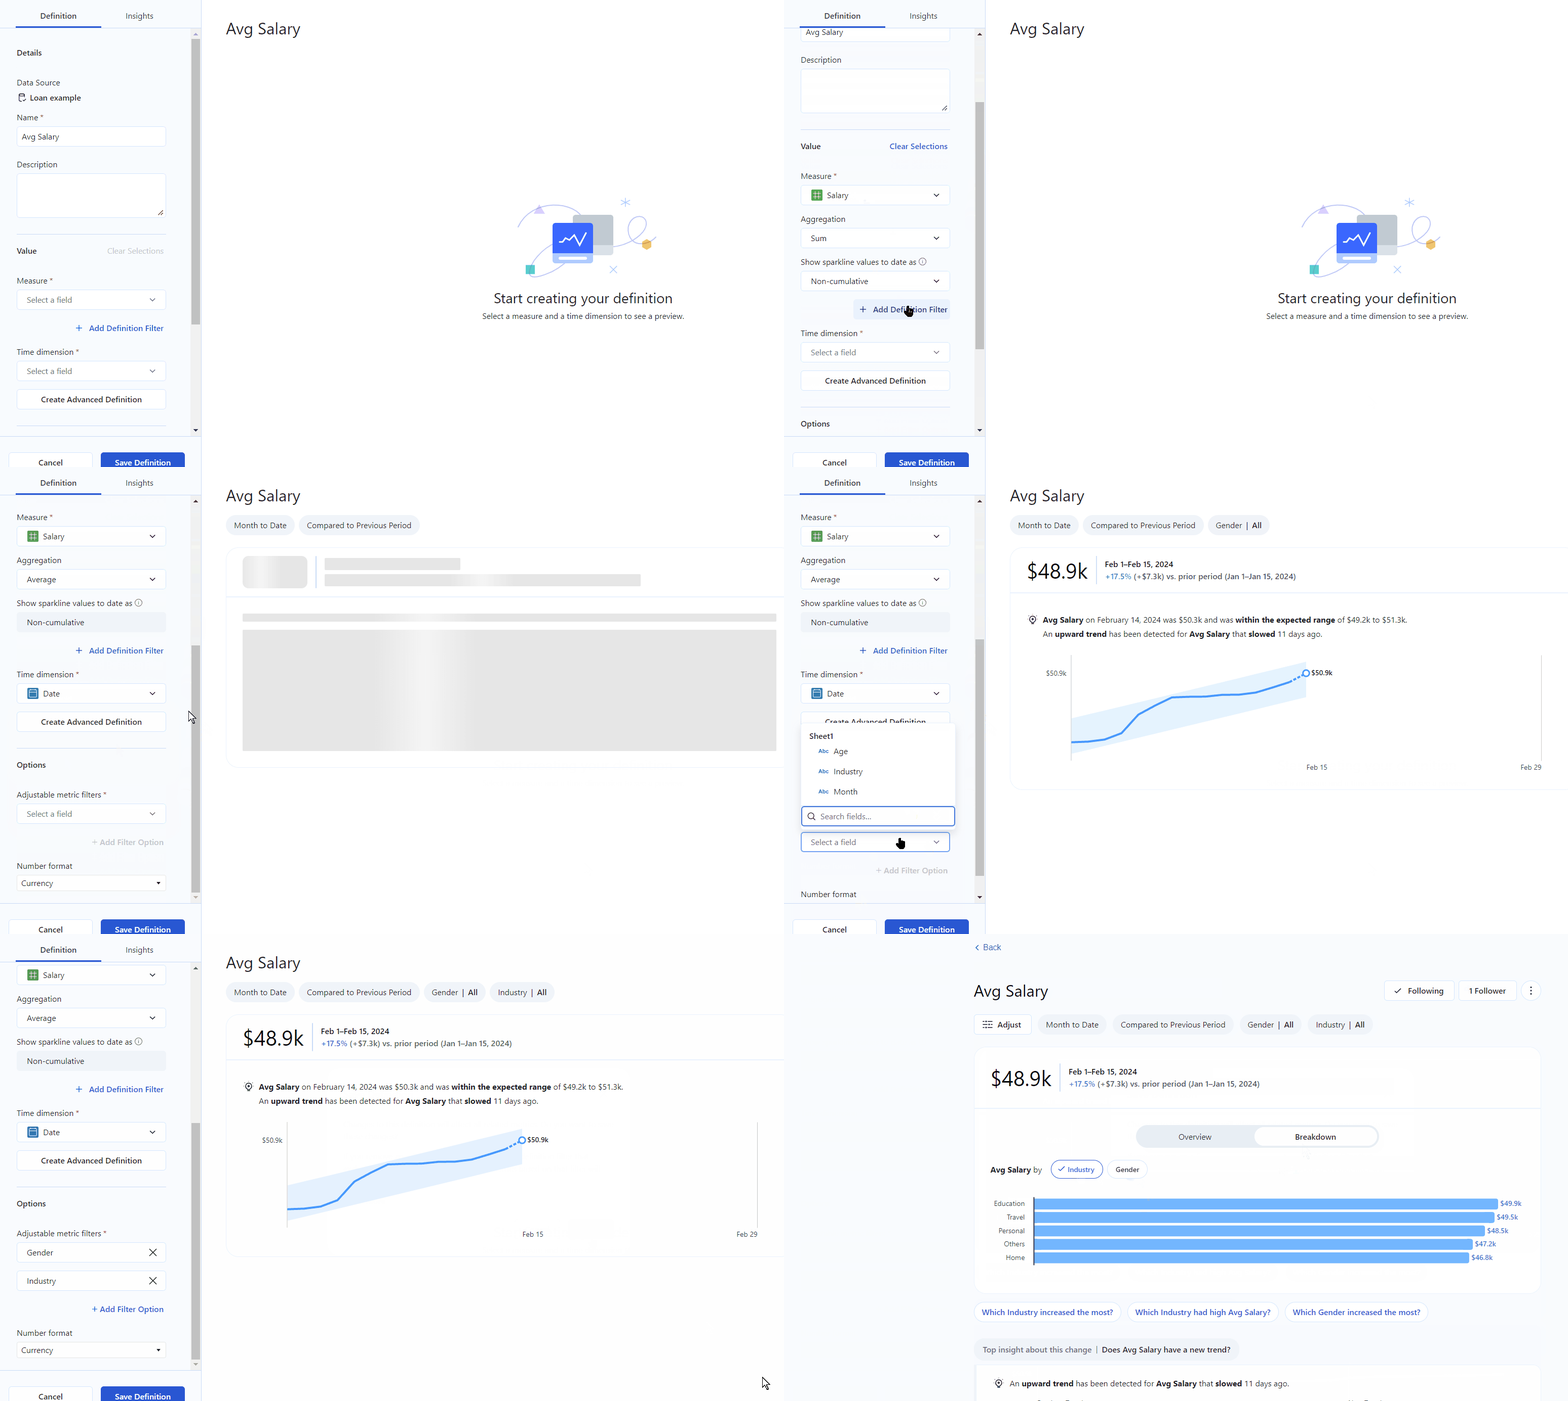
It is important to note that the only way to access Tableau Pulse currently is through Tableau Cloud. After importing the data, I added the definition for average salary, gender and industry.
Here is the final result:

▶️Tableau Pulse relies on date fields, so it’s really important to have a recent date field because it will not work otherwise. Failure to do so may result in the presence of null values, which could hold back the analytical process. For instance, without the inclusion of today's date in the dataset, null values might have been encountered instead, delaying the effectiveness of the analysis.
As you can see, this gave me the most important insights for the beginning of the month (1st February-15th of February), so it’s very practical for people that want to track their progress of sales for a certain period. Another important aspect is the capacity to monitor your metrics and seamlessly receive notifications via message or email when something important happen.
Advantages of Tableau Pulse:
Real-time Monitoring: Tableau Pulse stands out for its ability to provide immediate insights and monitor data streams in real-time, ensuring users are always up-to-date.
Timely Insights: Users can swiftly identify trends, fluctuations, and patterns as they emerge, enabling prompt decision-making and adaptability to changing circumstances.
User-Friendly Interface: Tableau offers an intuitive interface, simplifying data visualization and interpretation, thus enhancing analysis efficiency.
Disadvantages of Tableau Pulse:
Reliance on Date Fields: Tableau Pulse heavily depends on accurate and current date fields. Inaccuracies or outdated information in these fields may lead to errors or compromised insights.
Limited Analytical Scope: While Tableau Pulse offers real-time monitoring capabilities, its analysis may be confined to surface-level trends without searching the cause of the influencing factors.
Key Influencers findings
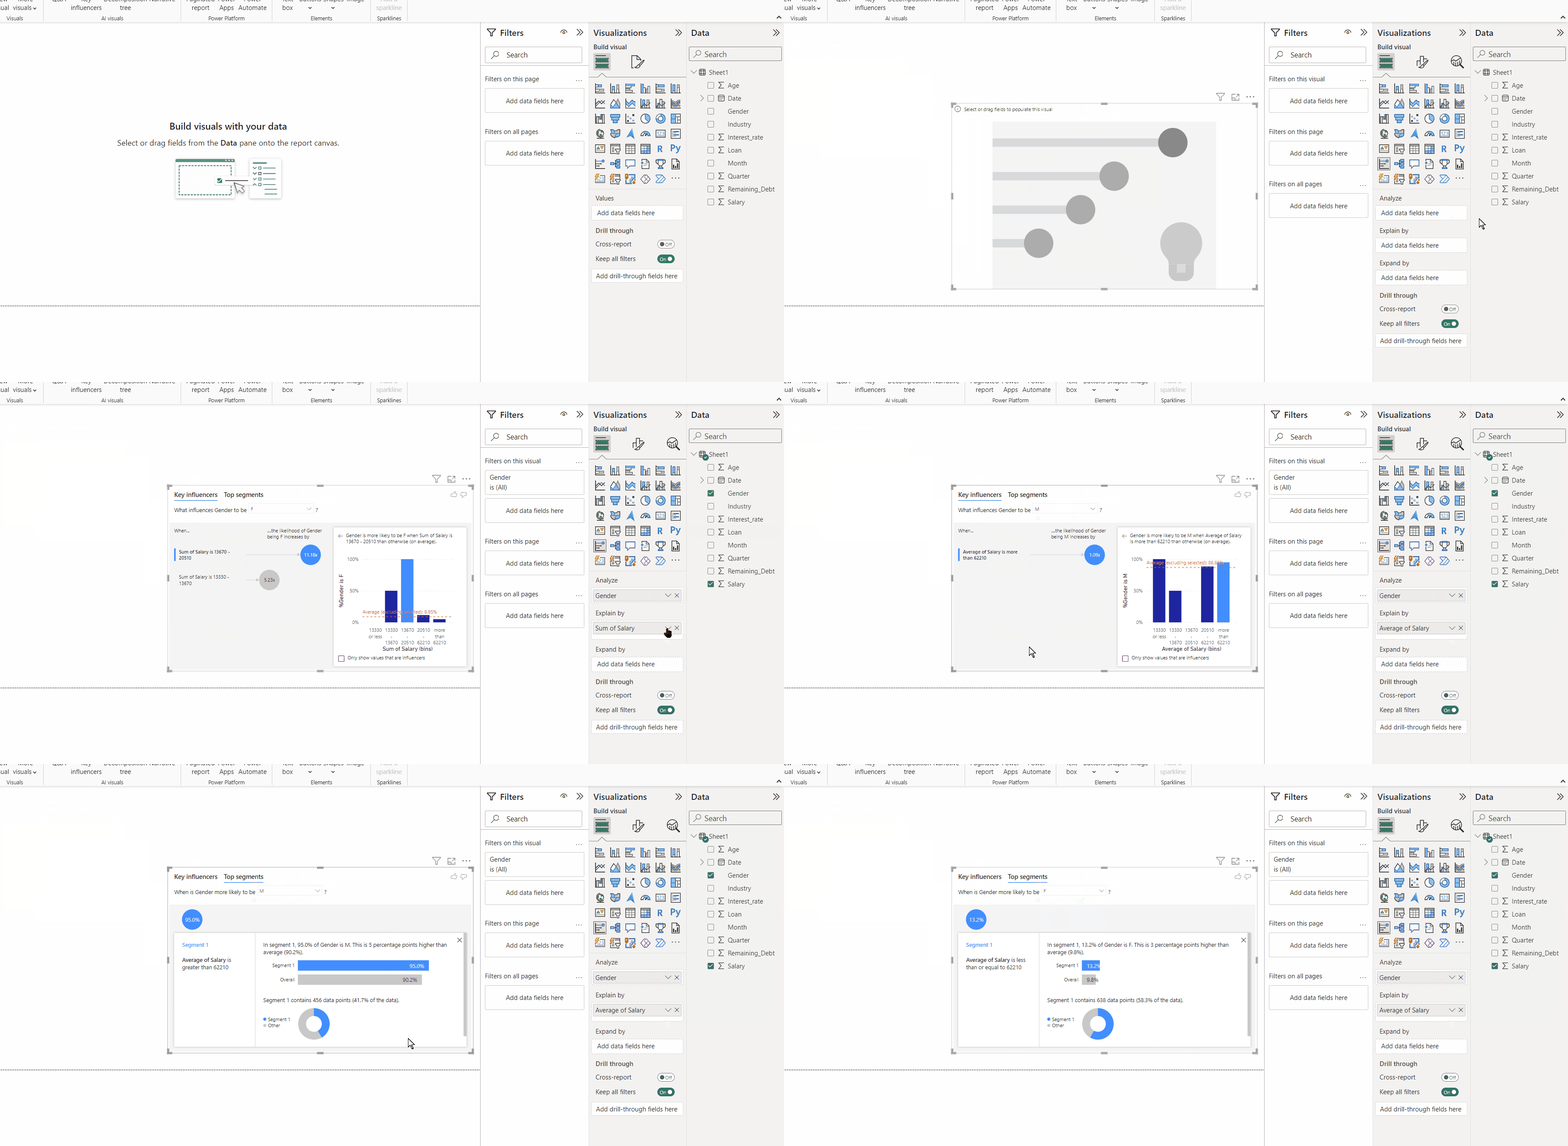
Upon importing the dataset into Power BI, I navigated to the Visualizations tab and dragged the Key Influencers graph onto the canvas. After, I added the gender field to the 'analyze' space and the average salary field to the 'explain by' space, facilitating a structured analysis of the dataset.

As you can see here we have different results than what we had in Tableau Pulse, and looks like there’s a significant difference between the average salary for females and the average salary for males throughout the years. That’s because Key Influencers has a more general approach than Tableau Pulse and is able to find the overall insights from the dataset regardless of time or period. For example, Key Influencers can work without a date field and is more comprehensive when it comes to showing major factors within the data.
Advantages of Key Influencers (Power BI):
Key Influencers in Power BI excels in identifying significant variables impacting specific outcomes within the dataset.
You don't need to use a date field in order to work with it.
Users can gain insights into the correlations and interrelationships among different variables, facilitating comprehension of underlying trends and patterns.
Key Influencers is adaptable to various analytical scenarios and dataset types, making it a valuable asset for data-driven decision-making processes.
Disadvantages of Key Influencers (Power BI):
Specific Analysis Focus: Key Influencers primarily focuses on identifying influential factors and relationships within the dataset, limiting its utility for broader exploratory analysis. The tool lacks the capability to analyze recent periods in comparison to previous ones.
Complexity: Power BI, including Key Influencers, may pose challenges due to its complexity, requiring users to overcome a potentially steep learning curve compared to more straightforward visualization tools like Tableau.
When comparing the results from both tools, it's crucial to take into account elements like how recent the data is, the methods each tool uses to analyze the information, and the extent of the analysis. While Tableau Pulse might show the latest changes in average salaries, Power BI could reveal more about broader trends and connections in the dataset over time.
I think that Tableau Pulse offers essential real-time monitoring capabilities, which are perfect for staying updated on datasets that are constantly changing. In contrast, Power BI Key Influencers is known for uncovering concealed patterns and relationships, making it especially useful for predictive analysis and strategic decision-making. Choosing between Tableau Pulse and Power BI Key Influencers depends on factors like the type of data that we have and the particular analytical objectives of the user.
