


The wave of innovation and marketing over the past year surrounding AI has been fascinating with the world of analytics not escaping its pull. Entirely new products have been launched, new features hastily added and departmental budgets torn apart in order to carve out spending for this new world.
If you look more closely however you’ll find that many of the capabilities exciting executives today were already in existence before anybody had heard of OpenAI or ChatGPT. These are known as predictive models or machine learning algorithms. Salesforce has had its “Einstein” feature since 2016 promoting it as “the Artificial Intelligence Revolution.” Back in 2014 Dataiku’s principal selling point was its Data Science Studio which promised to allow companies to leverage predictive models by connecting data scientists with line-of-business data analysts. Our very own partners Tableau merged machine learning and natural language processing to launch Ask Data in 2018 with Alteryx having always shipped with a collection of predictive tools powered by Python and R and more recently offering an additional add-on of machine learning tools in its Alteryx Intelligence Suite.
Clearly the capabilities you could label as “artificial intelligence” have been around for the past five to ten years leaving us with a key question to consider…
Why is everyone in the data analytics space suddenly falling over themselves to promote their 'new' AI features?
Why the AI Craze?
So why the sudden obsession with AI in the data analytics space? The answer lies in the revolutionary impact of generative AI (GenAI) and Large Language Models (LLMs) like ChatGPT. These models have transformed how humans interact with computers, enabling intuitive text-based communication and providing detailed responses to inquiries. This breakthrough sparked a wave of excitement and innovation, leading many businesses to believe, perhaps a bit too soon, that AI would render traditional knowledge work obsolete. Essentially the complexity of having a data scientist to work with had been removed and replaced with a simple text prompt.
Scratch the surface though and you find that there is was no real fundamental shift in the underlying analysis done by what is commonly regarded as AI. The shift was in fact in how we interface with pre-existing machine learning algorithms. LLMs are implemented either unidirectionally by surfacing the analysis created by machine learning algorithms to produce text-based human readable output or a bidirectional way, taking in for instance a request to generate a calculation or some workbook metadata and using models trained on existing calculations or workbooks to return a recommendation as the output. Either way they are using past data to generate probabilistic outputs, offering insights in a readable format accessible to all.
Today’s implementation of AI
Thankfully the hype has also started to calm down ever so slightly and we are seeing (mostly) fully developed implementations of generative AI emerge in the data space.
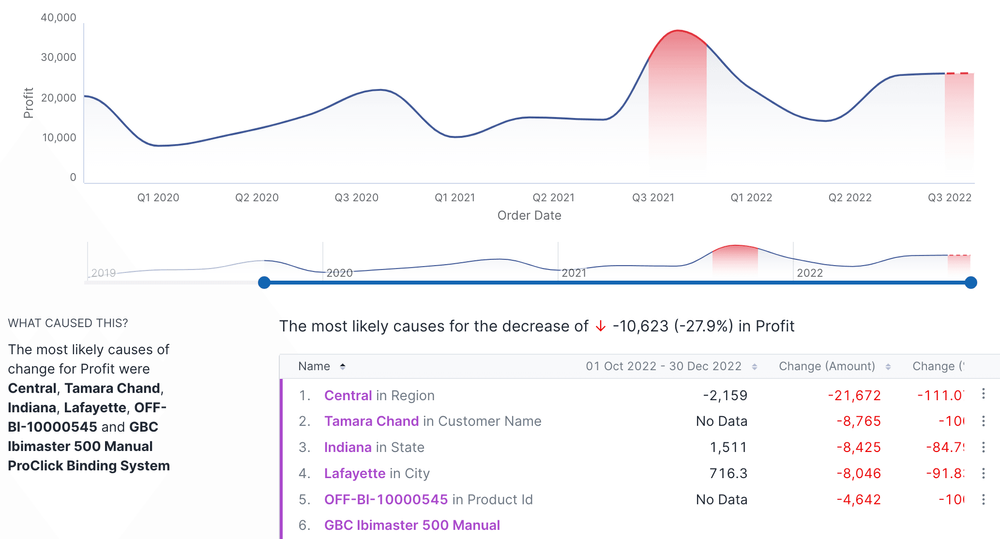
Both Tableau and Alteryx have chosen to focus on time-based analysis for their AI offerings of Tableau Pulse and Alteryx Auto Insights. In order to bridge the gap between complex data analysis and a text-based LLM developers chose to start with something fairly universal, impactful and easily understood. As it stands they are not sending raw data off to be processed by an AI algorithm but a description of summary data observed from what has happened in the past as compared to what’s happening today. Using machine learning they can further enhance this summary data into key drivers and give generative AI the ability to not only tell you whether sales are up or down compared to last year but what top drivers of that trend are. If the trend is positive the description will be of your top clients however if the trend is negative GenAI may return the names of your bottom products by profitability. Put simply “here is the trend in your data and here is the most likely cause for that trend.”
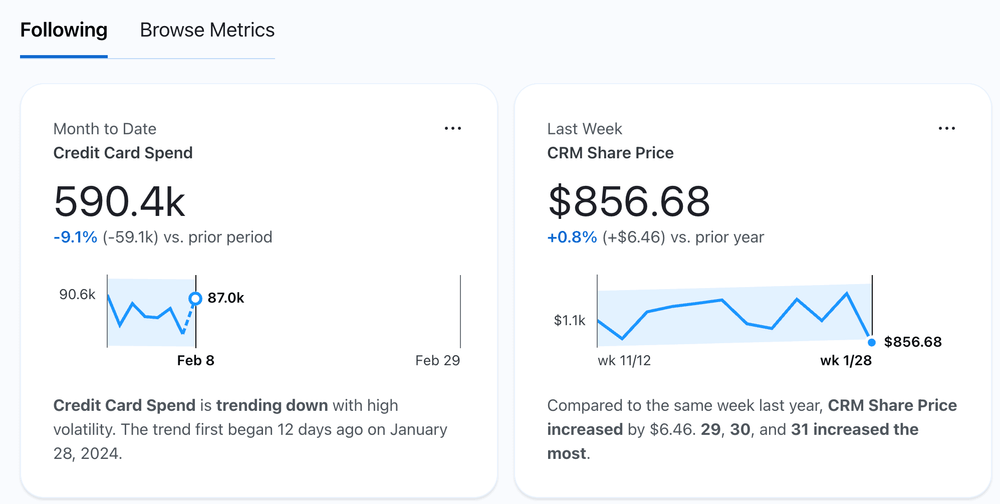
This is really useful for keeping an eye on key drivers for your business both in terms of revenue and cost. Being proactively informed that your sales are up compared to the same period last year with some context is a useful snippet of information to have each day. As is being informed that your costs are starting to overtake last year’s or that your profitability is dropping allows you to take action as soon as possible rather than letting it go unnoticed until the next financial reports are published.
At The Information Lab we are using Tableau Pulse to monitor our license revenue with multiple metrics focusing on different areas of the business. We have also configured metrics to look at the costs incurred by our Snowflake and AWS infrastructure. This allows us to go into meetings always with the knowledge of how we’re doing on a day to day basis as well as being aware of what is driving each outcome.
We were able to do this relatively quickly as our data is accessible from the cloud and our key data sources are relatively clean and well understood. This shouldn’t be underestimated and a good reason for your data scientist team to refresh their data engineering skills. In order to get the best out of these new AI features the data sources need to be free of clutter, at an appropriate level of detail for the analysis undertaken and have some historical meaning in the form of a timestamp of when each action (license sale, Snowflake credit spend, etc) took place. If you’d like some advice on getting your data ready please do get in touch, we are more than happy to help.
What should tomorrow’s AI look like?
As I say the 2023 hype of AI has thankfully subsided just a little and the reality of where we are with the technology has emerged. That means that today’s limitations are beginning to be uncovered.

I have already alluded to one limitation which is the need for data to be compatible with time-based analysis. The AI models in use don’t currently act in a way which suggests they can learn from gradually moving data. For today’s features to work you need a time-based snapshot of how things were or when things occurred.
This is one area I would like to see Alteryx and Tableau tackle with both an easy and seamless solution. They could either continually train the AI model on the entire dataset, allowing it to learn the full history of the dataset as it changes. This would be costly and very compute intensive as well as create a myriad of data protection and security questions. A cheaper and easier solution would be to automatically snapshot the dataset thus removing the need for pre-processing by the data owner.
Another aspect I would like to see tackled is future awareness. Currently the output from generative AI is very focussed on what just happened up to today as compared to a previous time period. For example you would expect to see the output “your sales are up 17% compared to this time last year.” You might look at this and think that’s a great reason to celebrate, however a good data analyst would not only look at the period to date but would also include the coming weeks and months. Yes you may be up 17% compared to last year but what you weren’t informed about is that a late sale last year came in early this year, accounting for that 17% increase. What GenAI should return is “your sales are up 17% compared to this time last year and to maintain that increase you need to sell £186,103 next week.” Oh dear! You only now have £15,000 left in your sales pipeline and so the 17% increase just isn’t sustainable.
Getting back to reality here at the time of writing Tableau Pulse is still to hit general availability and Alteryx Auto Insights is still implementing generative AI and CoPilot features on top of its existing machine learning-based tech stack. I’m keen to see how both companies evolve their offering over the next couple of years especially Tableau as they seem to be positioning Tableau Pulse as not just a new feature but a whole new platform on which anybody can see, understand and take action with data.