How to solve a Tableau 'distortion' in Alteryx
The Earthis a geoid – a 3D shape closely resembling a sphere. In order to represent this3D object on a 2D plane (a paper map or a computer screen) it isnecessary to “flatten” the object in some way. There are many, many ways inwhich we can “flatten” the 3D object. Each way produces a slightly differentview of the Earth, and preserves slightly different characteristics of thesphere:
- Area
- Shape
- Direction
- Distance
It is impossible to preserve both angle (direction) and area on the same flat map.
Withspatial data in a shapefile, it is possible to view which method (or “projection”)is in play by inspecting the associated .prj file. Take a look at thisblog post to figure out what the different file extensions mean.
Right click and open the .prj file with a text editor (notepad is fine) and you will see:

These are the instructions and parameters that tell the piece of software being used how to flatten the 3D shape and how to relate elements of it in space. Each projection has a different set of instructions. Tableau, however, is currently able to display one of these projections – Web Mercator. Even if the shapefile has a different set of “instructions” Tableau will convert it to Web Mercator before displaying it.
What does this mean?
- Forsmall areas (cities, for example) the distortion produced by the projection willbe functionally negligible;
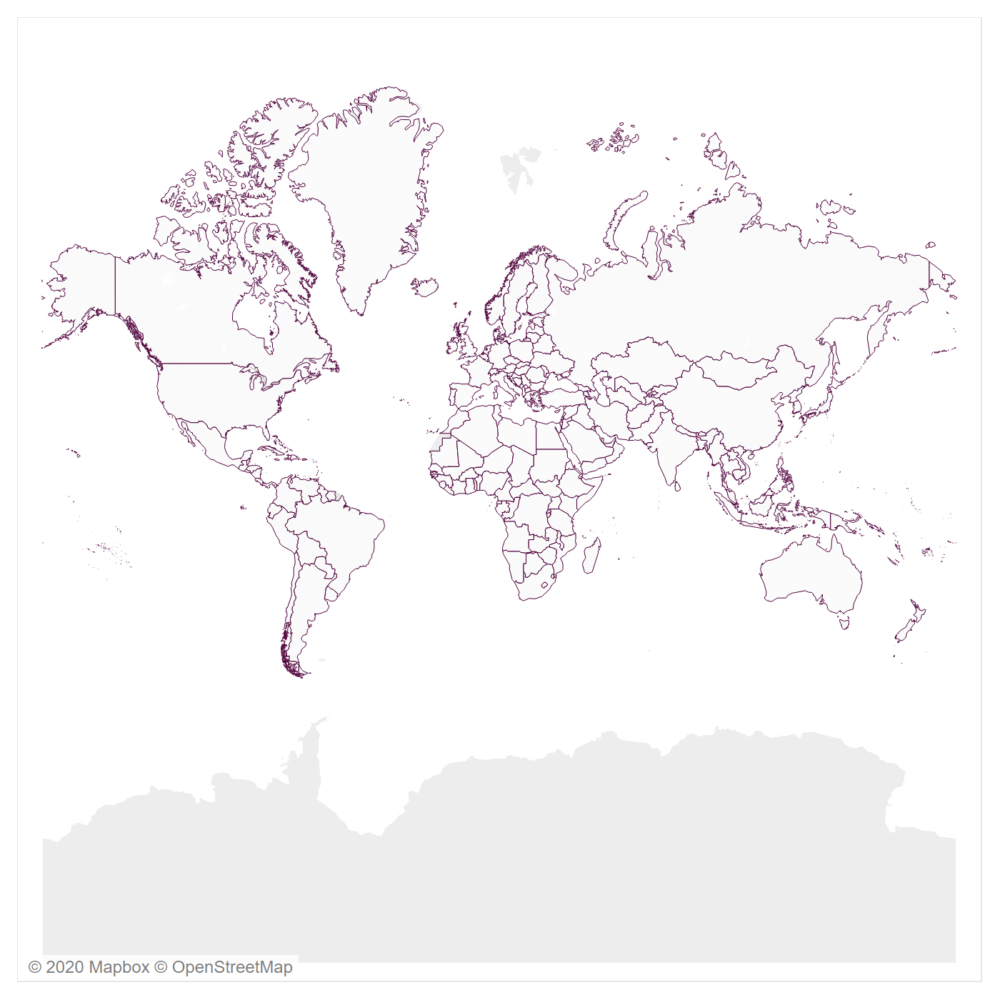
- Largerareas produce distortions that become much more severe towards the poles –those land masses will appear much larger than they actually are;
- Inthe example below, Greenland appears to be equal in size to the continent ofAfrica but Africa is actually around 15 times larger
Why does this matter?
- It may stifle creativity! Want to create a viz centred on Antarctica like Adam or Ellie? It is not possible natively in Tableau
- It (more importantly) introduces misleading elements to any map that includes population. Reading this blog from ESRI cartographer Kenneth Field is highly recommended
How can it be remedied?
We need to find a way to stop Tableau altering the shape of the data when it is displayed. For the full background theory and a method that does not use Alteryx, please enjoy this blog from Tableau research scientist Sarah Battersby.
For global views;
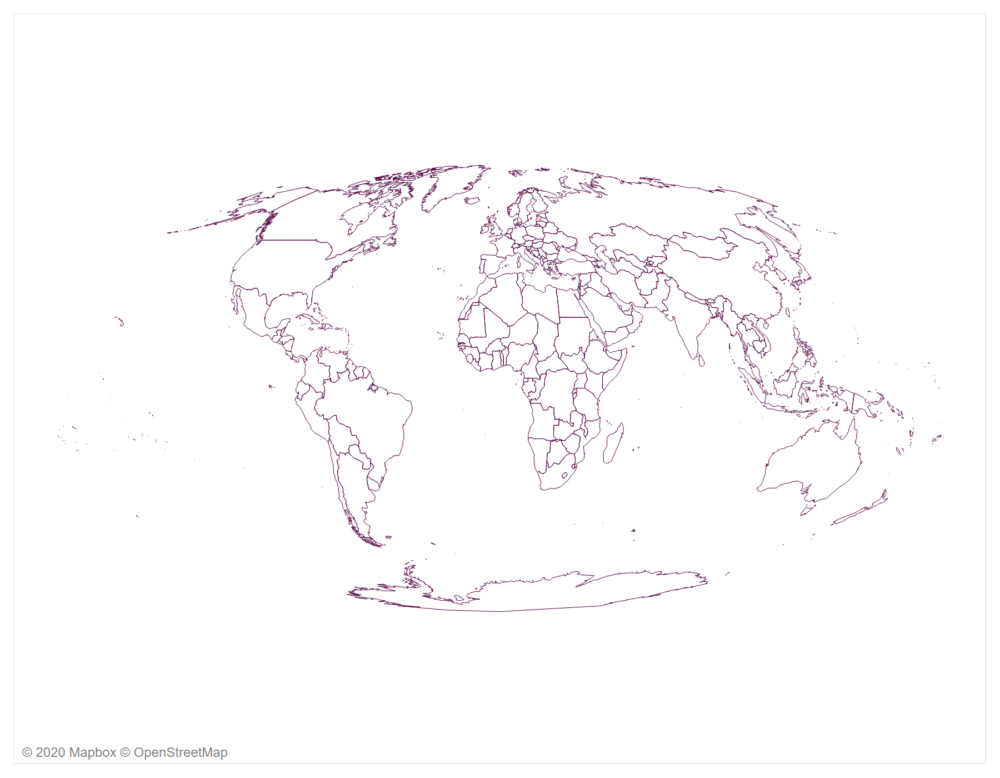
- Download country boundaries from natural earth and unzip. Keep all files in the extraction in the same place
- Check the projection of the shapefile in question (using a text editor)
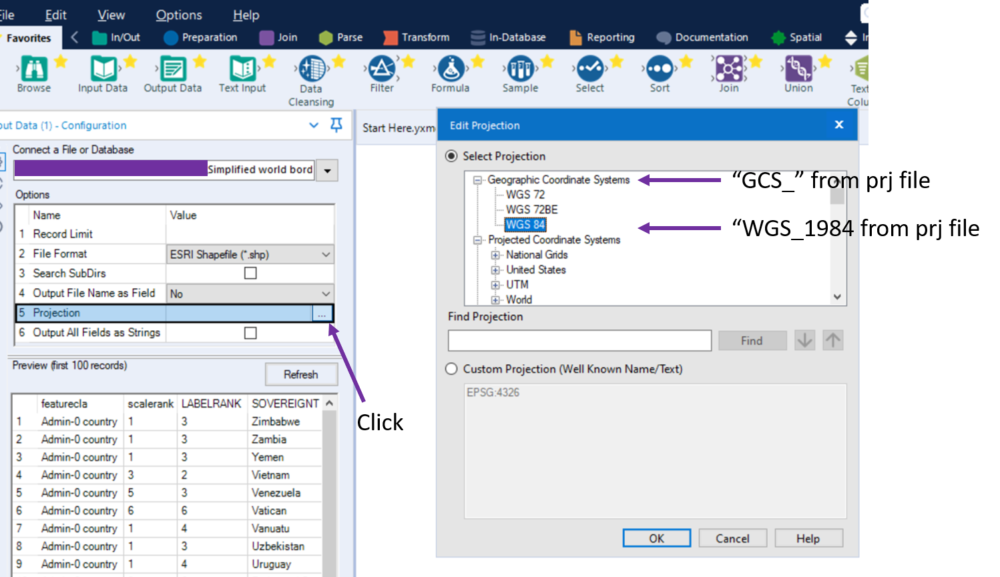
- Read the shapefile into Alteryx using the same projection
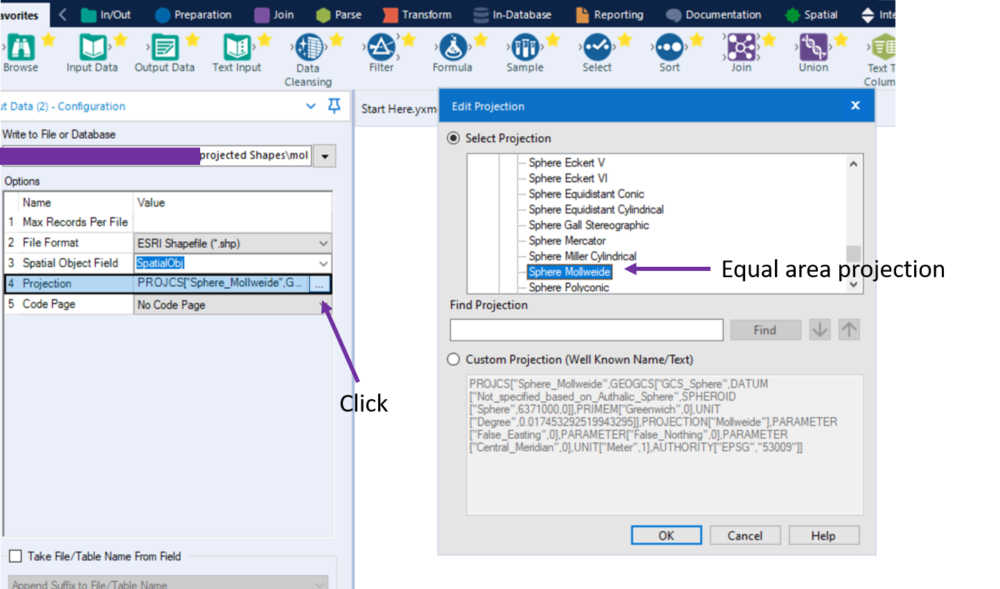
- Output the shapefile to a new location using the projection required (equal area projections are recommended for mitigating misleading effects in maps of population)
- Edit the .prj file text. Overwrite the text with:
PROJCS['WGS 84 / Pseudo-Mercator',GEOGCS['Popular Visualisation CRS',DATUM['D_Popular_Visualisation_Datum',SPHEROID['Popular_Visualisation_Sphere',6378137,0]],PRIMEM['Greenwich',0],UNIT['Degree',0.017453292519943295]],PROJECTION['Mercator'],PARAMETER['central_meridian',0],PARAMETER['scale_factor',1],PARAMETER['false_easting',0],PARAMETER['false_northing',0],UNIT['Meter',1]]
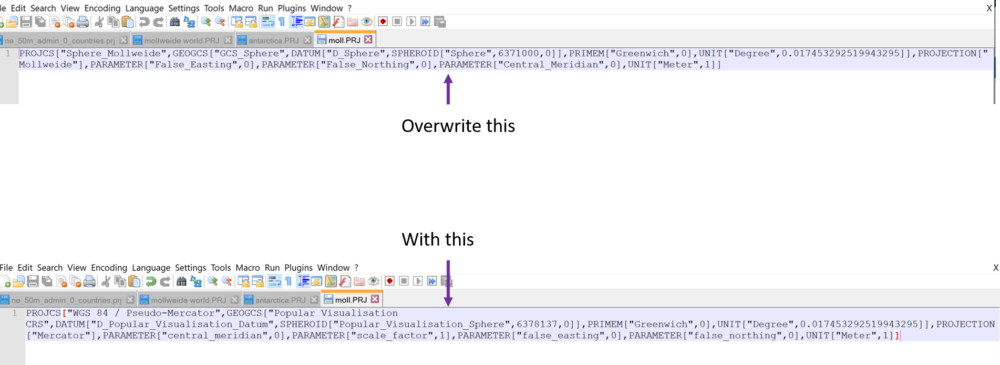
- Save the text file
This is the crucial step that will stop Tableau from trying to alter the underlying data to fit the Web Mercator projection.
- Connect to the shapefile in Tableau. Double click the [Geometry] field and wash out the background map entirely
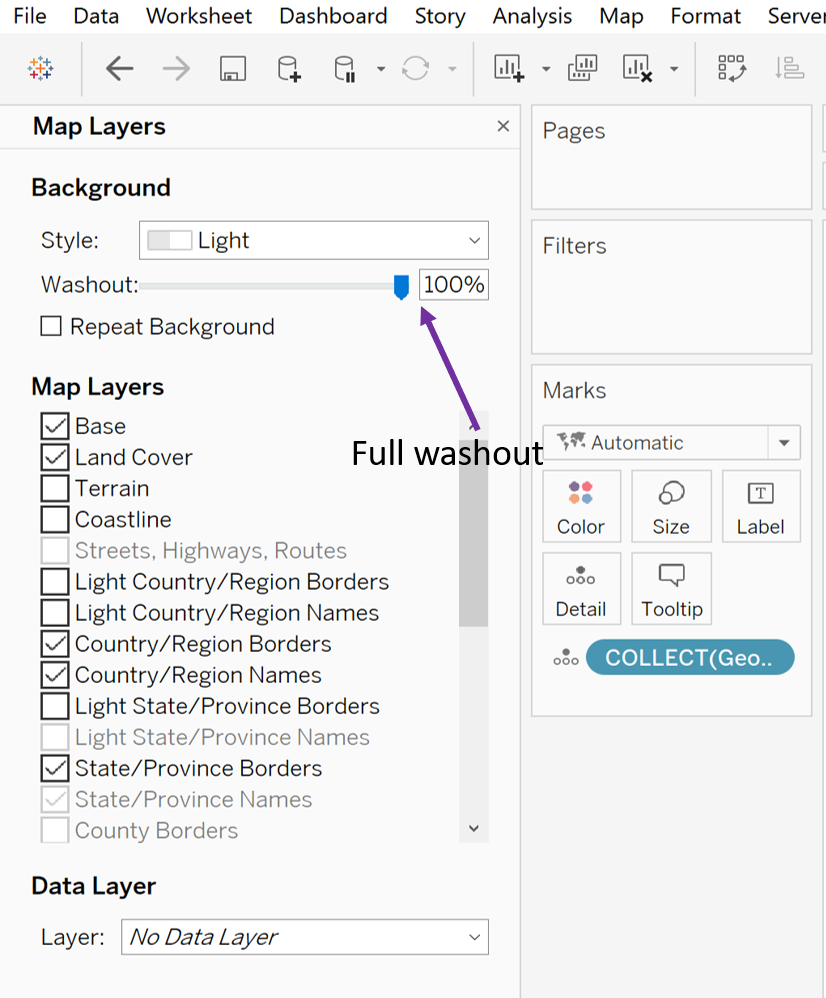
Et voila. Magic in Tableau

For local views;
There are many projections that are used for countries or continents (sub-global scale). Each fits a particular purpose. Select an appropriate projection for your purpose. In this example, Polar Stereographic is used to output an Antarctic – centred view for Tableau.
- Download country boundaries from natural earth and unzip. Keep all files in the extraction in the same place
- Check the projection and load into Alteryx, selecting the appropriate projection
- For Polar Stereographic it is impossible to display the entire Earth. Select out relevant countries – Antarctica, and perhaps Argentina or New Zealand
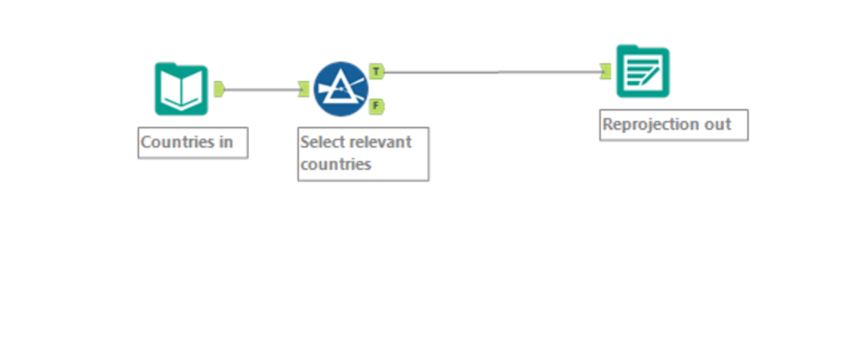
- Output the shapefile to a new location using the projection required
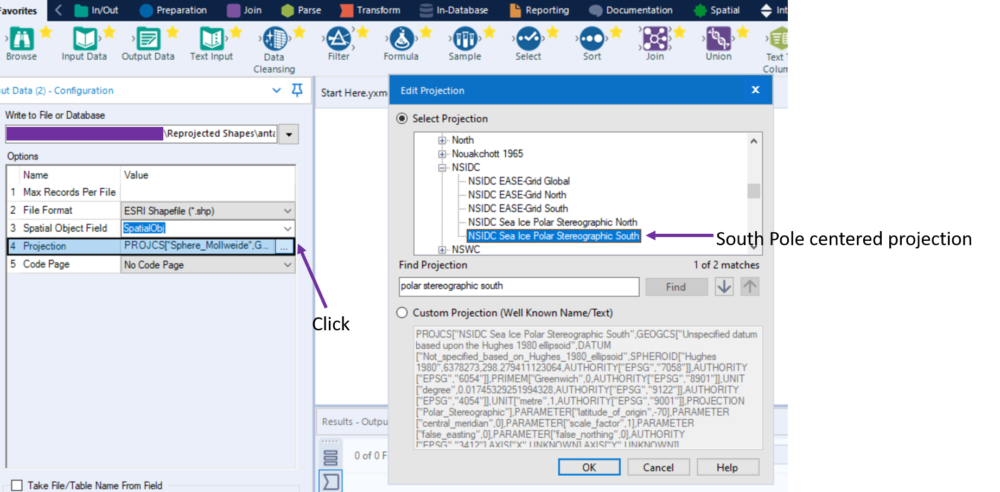
- repeat the step (above) of overwriting the .prj content with
PROJCS['WGS 84 / Pseudo-Mercator',GEOGCS['Popular Visualisation CRS',DATUM['D_Popular_Visualisation_Datum',SPHEROID['Popular_Visualisation_Sphere',6378137,0]],PRIMEM['Greenwich',0],UNIT['Degree',0.017453292519943295]],PROJECTION['Mercator'],PARAMETER['central_meridian',0],PARAMETER['scale_factor',1],PARAMETER['false_easting',0],PARAMETER['false_northing',0],UNIT['Meter',1]]
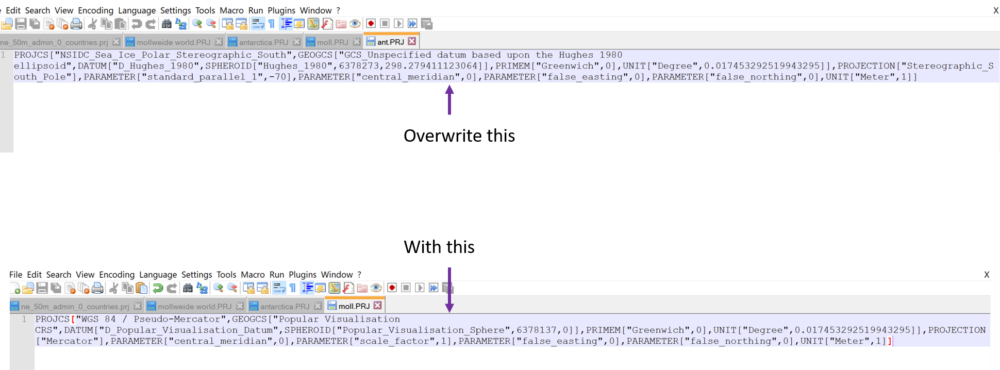
- save this new text in the prj file
- connect to the spatial file in Tableau. Double click the [Geometry] field and wash out the background map entirely
Voila. More mind-bending magic.
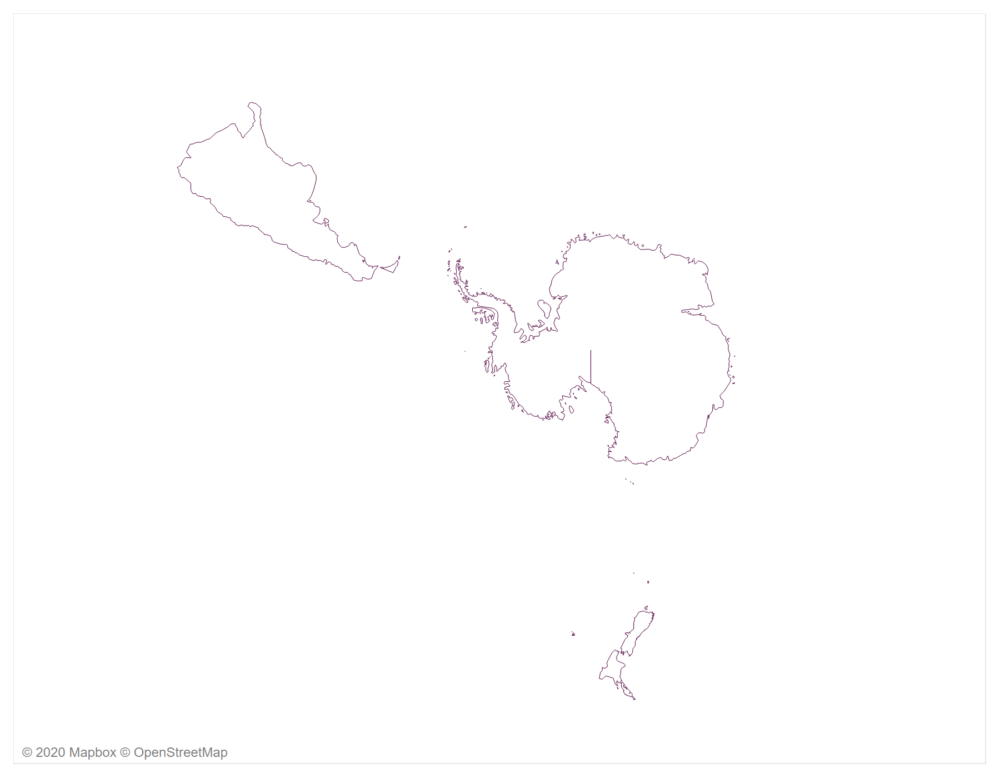
Enjoy your new-found freedom! Use it well.
