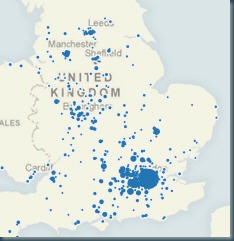
The Tableau data visualisation product produces geographic data visualisations in seconds if you are looking at data which includes references to US locations such as states, cities or zip codes. but this is not the case for the rest of the world. I guess to do so would have involved a lot of localisation for Tableau and probably added 100GB to the download size of the Tableau product.
I’m regularly asked how to plot data on Tableau map based visualisations using UK postcode data (or other geographical data for that matter). Its a simple solution, and one that works the world over.
You simply have to translate your geographic data into Latitude and Longitude information, and then Tableau will happily plot the information on a map of the UK.
I have created two files to explain this – firstly an EXCEL spreadsheet which contains sample sales data – this includes postcode data, and a VLOOKUP is used to link the postcode and the lat/long on the second sheet. Note that the match is made only on the first part of the postcode (the outcode) thus giving a lower level of resolution than you would get from a full postcode match. This is done as there are 17 million postcodes, and EXCEL would struggle.
I have also create a Tableau workbook which shows this in action.
If you get this right, you’ll end up with something like this:
Best of luck.
Tom

