

10 January 2017
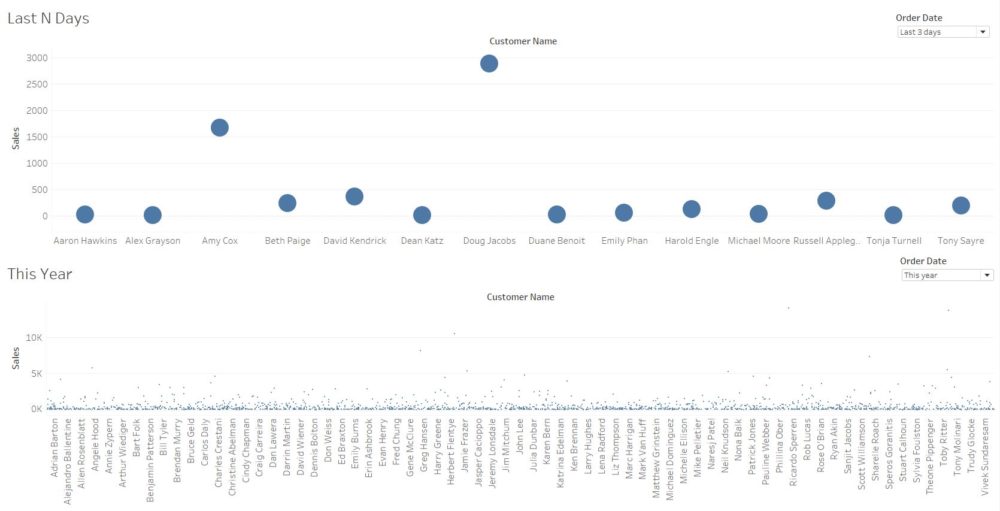
I was asked this question during a training session and it took me little while to get my head around it so I thought I would put my answer in a blog. As with everything in Tableau I am sure there is more than one way to achieve this result so feel free to let me know!The request was to show customer’s orders over the last N days in one view, and then in another view, on the same dashboard, show those same customer’s orders over the last year. Now, if your customer base is consistent and orders are consistent every day, then this is a simple task. Looking at the view below though, you can see the issue in superstore sales.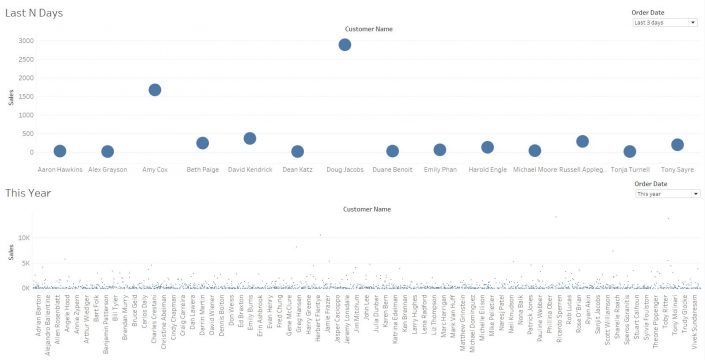 In the Last N Days view we have 14 customers, in the year view we have 693. Obviously we could add some dashboard actions to filter or highlight based on the user selections but to just give the user those 14 customers in both views was the requirement. This is how I did it.Firstly I created a parameter for the user to choose the number of days back from today they wanted to see.
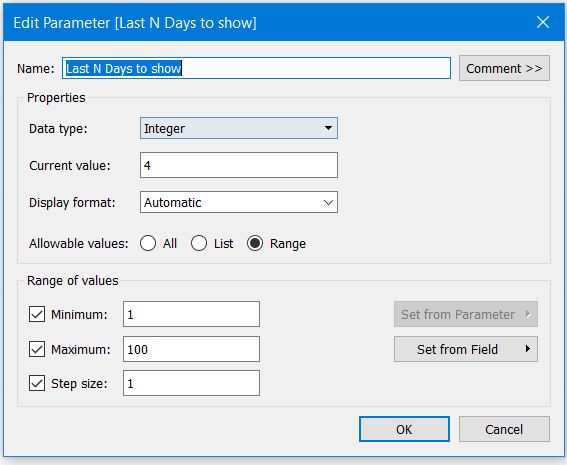 I then created a new date field, subtracting the number of days selected in the parameter from today’s date.
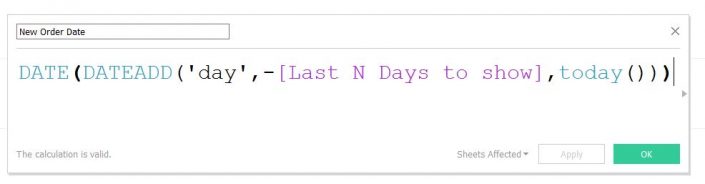 Using this in a new calculation to create a Boolean filter.
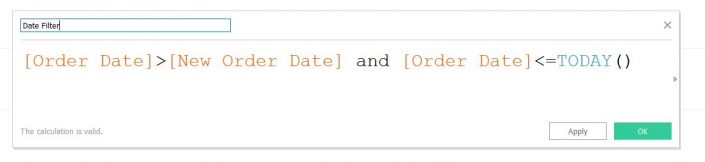 Applying this to my Last N Days view and selecting “True”
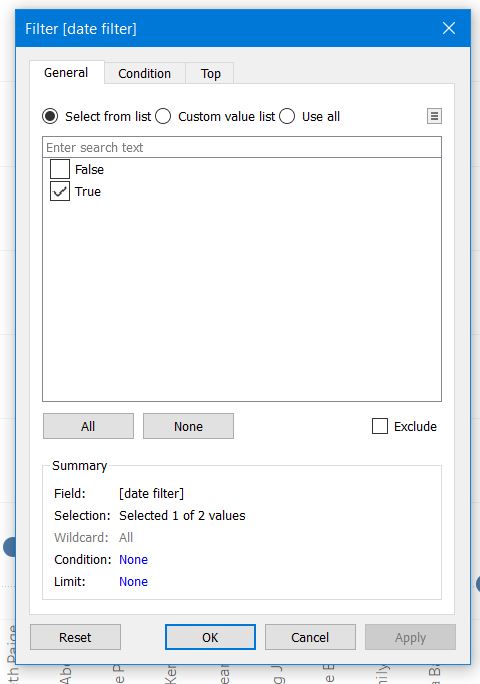 This now allows the Last N Days view to be adjusted when the user selects the required value of N in the parameter.I then created another calculation which will give me the value of orders if the order date is within the N days selected by the user. If not, it will return Null.
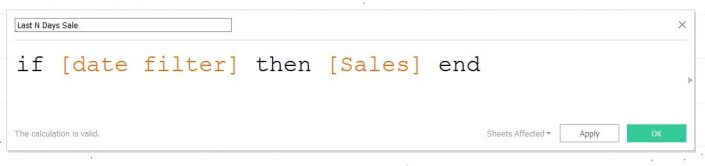 This calculation can then be used as the condition for a set, created on the Customer Name field.
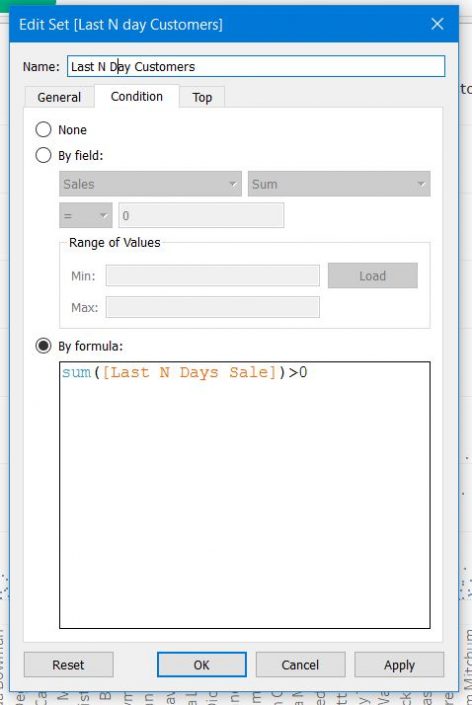
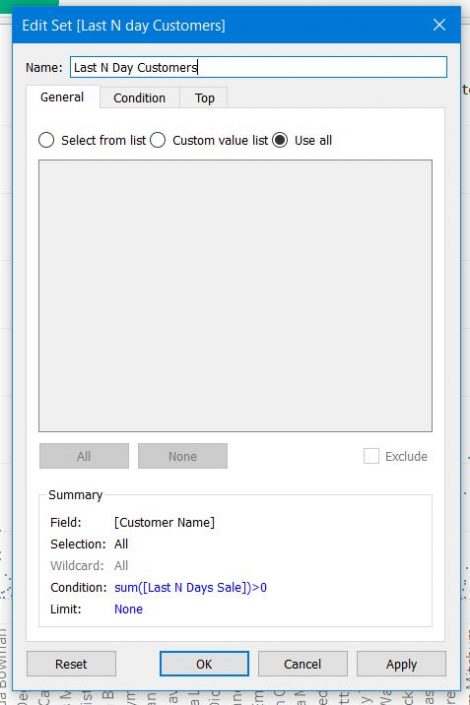 As this is a set based on a dynamic calculation, as the parameter changes the set will update to reflect that. The result of this set will give us only the customers that have sales within the selected time period. This set can then be used as a filter on the This Year view.The resulting dashboard will show two views. The top view shows sales for customers in the last N days, the bottom view shows sales over the last year for the same customers, making it easy to see if these are returning customers or new customers.
 To take this one step further, you could colour the orders that were in the last N days to give a clearer view to the user.
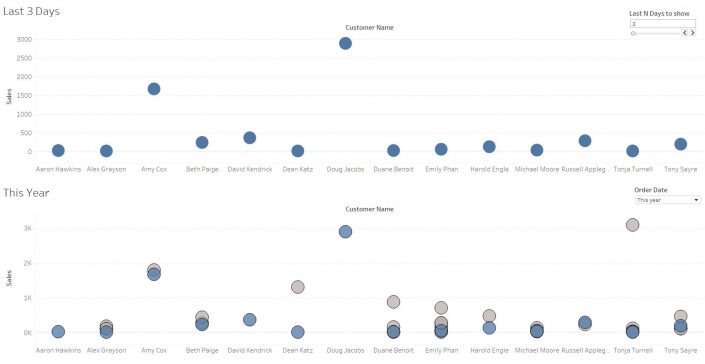 To do this I created a new calculation
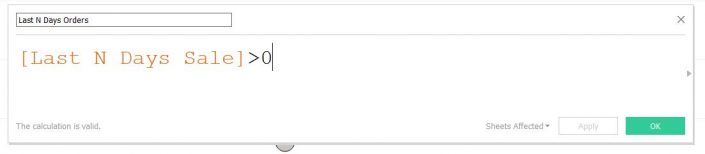 Then placed this onto colour in the This Year view, so the orders throughout the year are a different colour (grey) to the last N days orders (blue) I then reduced the opacity and added borders to make them a little easier to see.The resulting workbook is published to my Tableau Public profile, if you want to take a look - https://public.tableau.com/profile/andrew.pick#!/vizhome/ComparingLastNDays/LastNDaysComparison
 In the Last N Days view we have 14 customers, in the year view we have 693. Obviously we could add some dashboard actions to filter or highlight based on the user selections but to just give the user those 14 customers in both views was the requirement. This is how I did it.Firstly I created a parameter for the user to choose the number of days back from today they wanted to see.I then created a new date field, subtracting the number of days selected in the parameter from today’s date.Using this in a new calculation to create a Boolean filter.Applying this to my Last N Days view and selecting “True”This now allows the Last N Days view to be adjusted when the user selects the required value of N in the parameter.I then created another calculation which will give me the value of orders if the order date is within the N days selected by the user. If not, it will return Null.This calculation can then be used as the condition for a set, created on the Customer Name field.As this is a set based on a dynamic calculation, as the parameter changes the set will update to reflect that. The result of this set will give us only the customers that have sales within the selected time period. This set can then be used as a filter on the This Year view.The resulting dashboard will show two views. The top view shows sales for customers in the last N days, the bottom view shows sales over the last year for the same customers, making it easy to see if these are returning customers or new customers.
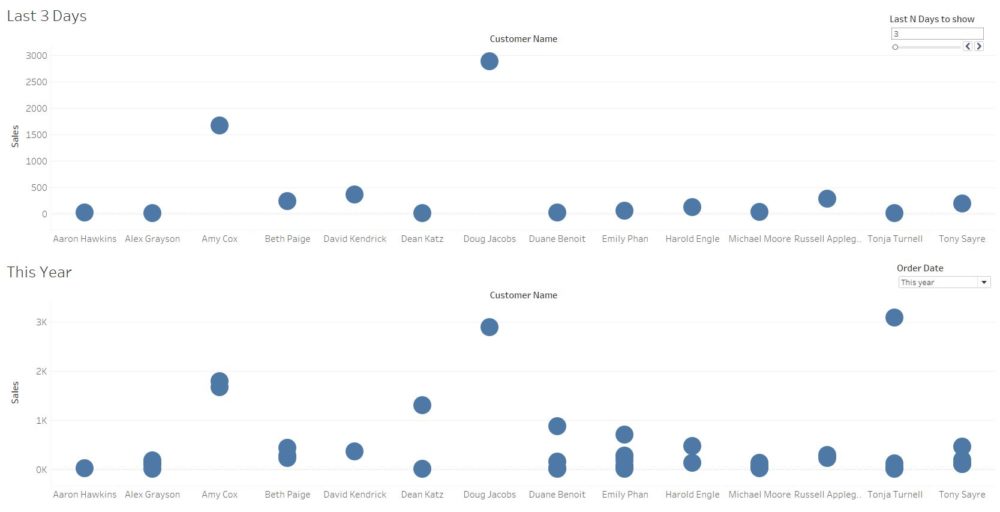 To take this one step further, you could colour the orders that were in the last N days to give a clearer view to the user.
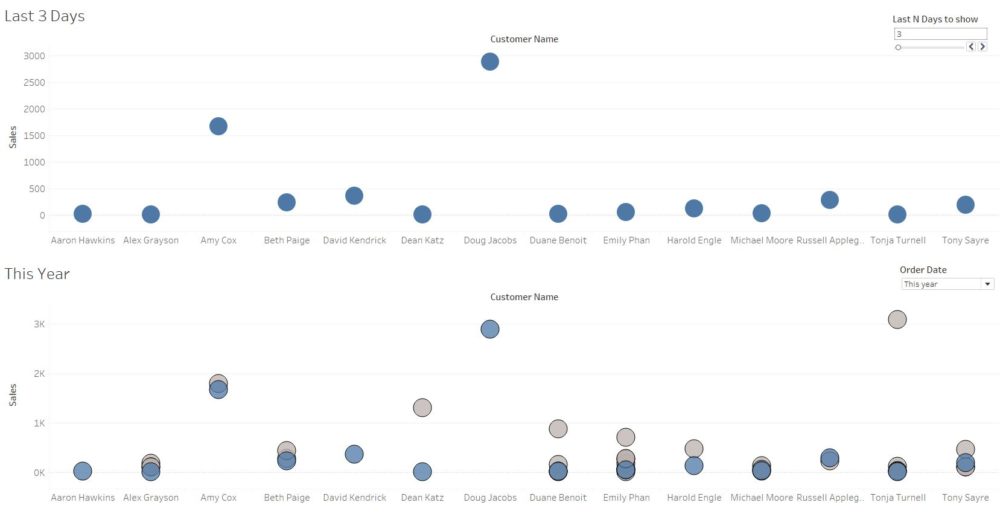 To do this I created a new calculationThen placed this onto colour in the This Year view, so the orders throughout the year are a different colour (grey) to the last N days orders (blue) I then reduced the opacity and added borders to make them a little easier to see.The resulting workbook is published to my Tableau Public profile, if you want to take a look - https://public.tableau.com/profile/andrew.pick#!/vizhome/ComparingLastNDays/LastNDaysComparison