Tableau Basics – The Data Query Process
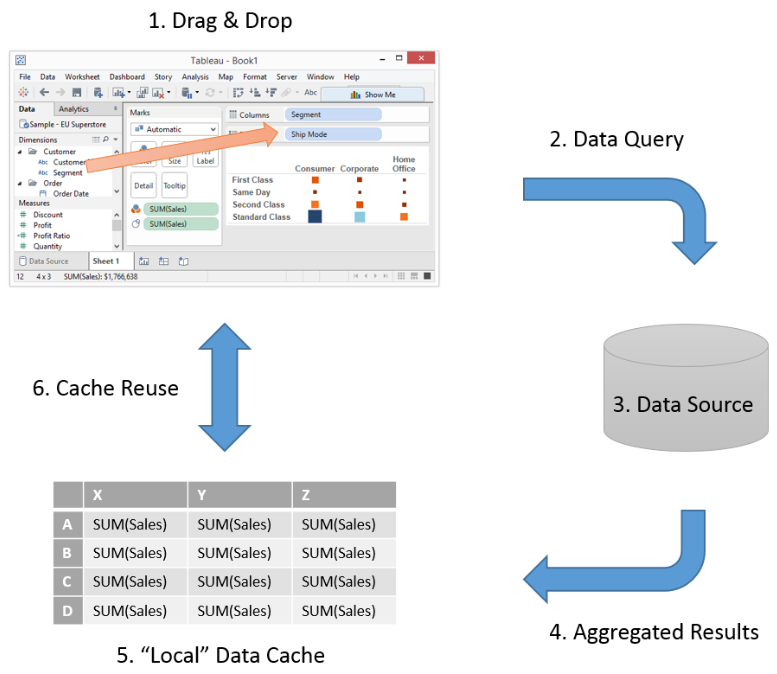
As a consultant and Tableau Trainer here at The Information Lab I often find myself drawing out the Tableau Data Query Process to clients and students alike. Rolling back to basics is such a good way to set the scene for many topics in Tableau. With that in mind, I thought it would make a great introductory blog post for those early on in their own Tableau journey.So what am I talking about? Well I’m going to take a little look under the covers to see how the magic happens when you interact with Tableau. Just how does Tableau convert your action of dragging something from your Data Window and dropping it into your View?Here’s a simple process diagram to set the scene:
Process Explanation
- Your interaction with Tableau is the trigger, a catalyst to initiate the process. Dragging a Dimension from the Data Window to the Row Shelf, dragging a Measure from the Data Window to the Marks Card etc are all triggers to the process.
- Tableau will convert your visual interaction to a specific data query, optimised for your Data Source. If you’re familiar with SQL constructs, you could think of a pseudo query such as:
SELECT SUM([Sales])GROUP BY [Segment], [Ship Mode]
Part of the magic of Tableau is the ability to tailor that data query to whichever type of Data Source you are connecting to.
- The Data Source is defined by the Data Connection in use in your View, be it Excel, SQL Server, Oracle etc. It is this Data Source which is responsible for serving up the results of the data query.
Key point to note, if your Data Source is slow to serve up its results, whilst Tableau have optimised their connectors, your Tableau viz is going to be constrained by that same query speed.
- Aggregated results are returned from the Data Source, as per the structure (partitions) defined within your View.
Defining items are typically your Blue items (pills) on your Row and Column Shelves and the Marks Card.
- Tableau will “cache” the aggregated results for possible re-use.
If Tableau can reuse cached results to service a data query, it will do so, removing the cost of the Data Source query. With this the data is returned to Tableau, and the results are rendered to your View
Application – Calculations
One application of the above theory is to explain 2 key types of Calculation in Tableau.Consider the Superstore Sales data set (although analogous to many) where you have a set of sales order lines with a value for Profit and a value for Sales. Understanding the Profit Ratio which is the Profit as a proportion of Sales is a common desire.
| Row ID | Sales (£) | Profit (£) | Profit Ratio |
| 1001 | 500 | 100 | 0.2 |
| 1002 | 100 | 80 | 0.8 |
| 1003 | 200 | 40 | 0.2 |
A novice Tableau user may opt for a new Calculated Field containing a calculation such as [Profit] / [Sales]. Initially that appeals as it’s the calculation which produces the values of Profit Ratio set out above for each row. And those last 3 words are crucial, it’s a
Row Level Calculation.As we saw in the simple process diagram, Tableau works with aggregate results, so when you drag your new Calculated Field into a new View you’ll see Tableau apply a default aggregation – Sum.

So in the above case that’s 0.2 + 0.8 + 0.2 = 1.2That’s clearly not right, it implies a Profit Ratio of >100%You could change the Measure applied to Sales and ask Tableau to perform an Average operation

In this case its (0.2 + 0.8 + 0.2) / 3 = 0.4That looks plausible, but at this point it’s worth reinforcing the Data Query Process and how this calculation is being evaluated.The process initiates when you drag Profit Ratio into your View.Tableau generates a Data Query which will contain the calculation [Profit] / [Sales]. The Data Source will be asked to perform the calculation for each row, and to then return the aggregated results as per the chosen measure. If we consider the 2 measure choices above, and use pseudo SQL again we haveE.g. SELECT SUM ( [Profit] / [Sales] )OrE.g. SELECT AVG ( [Profit] / [Sales] )These values are cached and the data returned to Tableau to render in our View.Averaging or summing percentages or ratios is not correct here, so the logical conclusion is that we don’t want the calculation to happen at the row level, instead we want to perform an
Aggregate Calculation utilising the totals for [Sales] and [Profit]. Let’s add that to the table to make it clearer
| Row ID | Sales (£) | Profit (£) | Profit Ratio |
| 1001 | 500 | 100 | 0.2 |
| 1002 | 100 | 80 | 0.8 |
| 1003 | 200 | 40 | 0.2 |
| | | 1.2 or 0.4 |
| Totals | 800 | 240 | 0.3 |
We can achieve this in Tableau by changing the calculation in our Calculated Field named Profit Ratio to SUM( [Profit]) / SUM( [Sales])Now when we drag this Calculated Field into our View we see there is no Measure option, Tableau has already identified it as the result of an aggregation and wrapped it in AGG.

So back to the Data Query Process.Again, process initiates when you drag the Profit Ratio into your View.Tableau generates a Data Query which will consider both [Profit] and [Sales]. The Data Source will be asked to process the aggregation for each, and to compute the Profit Ratio over those aggregations. With some pseudo SQL again we haveE.g. SELECT SUM ( [Profit] ) / SUM ( [Sales] )These values are cached as before, with the results are returned to Tableau and the results rendered to our View.In the example above, the results would be 240 / 800 = 0.3Hopefully that highlights the key differences in Calculations, specifically
- Do you want to operate at the row level?
- Operate over the results of aggregation?
Just one caveat to be aware of, is that you cannot mix aggregate and row level (non-aggregate) calculations in Tableau. Hopefully that is intuitive from this post, but to re-iterate the reason is because they happen at different points in the process. Once aggregation has taken place, row level information is not available.
Further Applications
The basics of the Data Query Process setup the explanation of other subject areas in Tableau. Two more complex topics that spring to mind are Table Calculations and Blending. Both of these operate over those aggregated results. If you've not already, armed with the knowledge of the above process, it might be a good time to take a look at our blog series which introduced
Table Calculations. I'll be back with another Tableau Basics blog on the topic of Blending.

