I've seen first-hand the benefit of building personal projects on Tableau Public post-training advanced my skills, how could we have the same thing for SQL? Typically it's hard to do, especially if you don't have access to a database, and if you do it's not usually the best environment to test and learn without breaking something and causing a lot of headaches.
After spending over a decade with SQL daily, I know the struggle to get proficient and out of the typical tutorial hell. I developed the Summer of SQL as an initiative designed to build skills and confidence with SQL, and a portfolio of skills to show off by solving real-world problems.
How It Works
Firstly, no it's not just for the summer. The Summer of SQL can be participated at any stage. I recommend having some knowledge of the SQL syntax with interactive tutorials on SQLBolt available for a good refresher.
Next, you're diving into a range of different changes starting with the SQL Murder Mystery. In this challenge you'll be querying crime scene reports, matching evidence to data about the citizens to find the killer and maybe more!
If that sounds a little daunting with each challenge I provide a video walkthrough. This is to help you:
Start on the right track with the challenges
Understand common errors and how to fix them,
and explore different ways of solving the problems
Solutions are available too if you want to check your answers.
The challenges processively build on these skills. Next, you could find yourself helping with a sushi restaurant, reshaping data for a bank and even setting up a local database. These are curated from community sources such as Data with Danny, Preppin' Data and a few of my own challenges. They are structured so you tackle a variety of problems and build a range of skills at a good pace.
You can expect to learn techniques like:
Joining Several Tables
CTEs, Recursive CTEs and Subqueries
Window functions like ROW_NUMBER()
PIVOT, UNPIVOT and splitting comma-separated strings
Setting up a database, importing data and creating a schema diagram (ERD)
And much more.
The Challenges
Week | Challenge | Estimated Time | Skills Tested | Walkthrough | Solutions |
|---|---|---|---|---|---|
1. | 1/2 a day | - Filtering with WHERE - JOINing tables - Aggregations and GROUP BY - String Functions and Pattern Matching (LIKE) - Subqueries and CTEs (optional) | |||
2. | Data with Danny: Danny's Diner | 1 day | - Ranking - Common Table Expressions (CTEs) - Case Statements - Dates and Scalar functions | ||
3. | Preppin' Data: - 2023 Week 1 - 2023 Week 2 - 2023 Week 3 - 2023 Week 4 | 1 day (in total) | - String manipulation with SPLIT_PART and REPLACE - UNION ALL vs UNION -Using ROW_NUMBER for deduplication - Pivoting data with PIVOT and UNPIVOT - Common Table Expressions (CTEs) | ||
4. | Data with Danny: Pizza Runner | 2 days | - Searching Text - Case Statements - NULLs - Datetime and Scalar functions - Comma Separated Strings - Aggregation, Unions - CTEs - Type Conversions | ||
5. | Data with Danny: Foodie Fi Sections A & B | 1 day | - CTEs - Row Number - Date Functions | ||
6. | Preppin' Data: - 2023 Week 5 - 2023 Week 6 - 2023 Week 7 - 2023 Week 8 | 1-2 days (in total) | - Multi-condition RANKing - Using CASE statements for conditional logic and categorization - Complex JOIN operations - Handling null values and splitting strings into rows with SPLIT_TO_TABLE - Applying ROUND function for rounding numeric values | ||
7. | Portfolio Project: Lego Creator Lego Analysis Challenge | 1-2 days | - Setup a local database - Load data to database - Create a user/role - Connect to dBeaver, Tableau, Python - Create a schema diagram (ERD) - Analyse data and create a view - Visualise the data in Tableau | ||
8. | Data with Danny: Data Bank Section A | 1 day | - Calculating stats - Median - Percentile | ||
9. | Preppin' Data: - 2023 Week 9 - 2023 Week 10 - 2023 Week 11 - 2023 Week 12 | 2 days (in total) | - Running SUMs - Recursive CTEs - Setting Variables - Math functions - Filling in blank data points | ||
10. | Data with Danny: Data Bank Section B | 1 day | - End of month calculations - Running sums - conditional aggregations | ||
Bonus! | Portfolio Project: The SQL Olympics | 2 days | - Setup a mySQL database - Load data to database - Connect to dBeaver & Tableau - Create a data model and a schema diagram (ERD) - Analyse data and create a view - Visualise the data in Tableau |
More details and future updates can be found here:
https://github.com/wjsutton/the_summer_of_sql
The Rewards
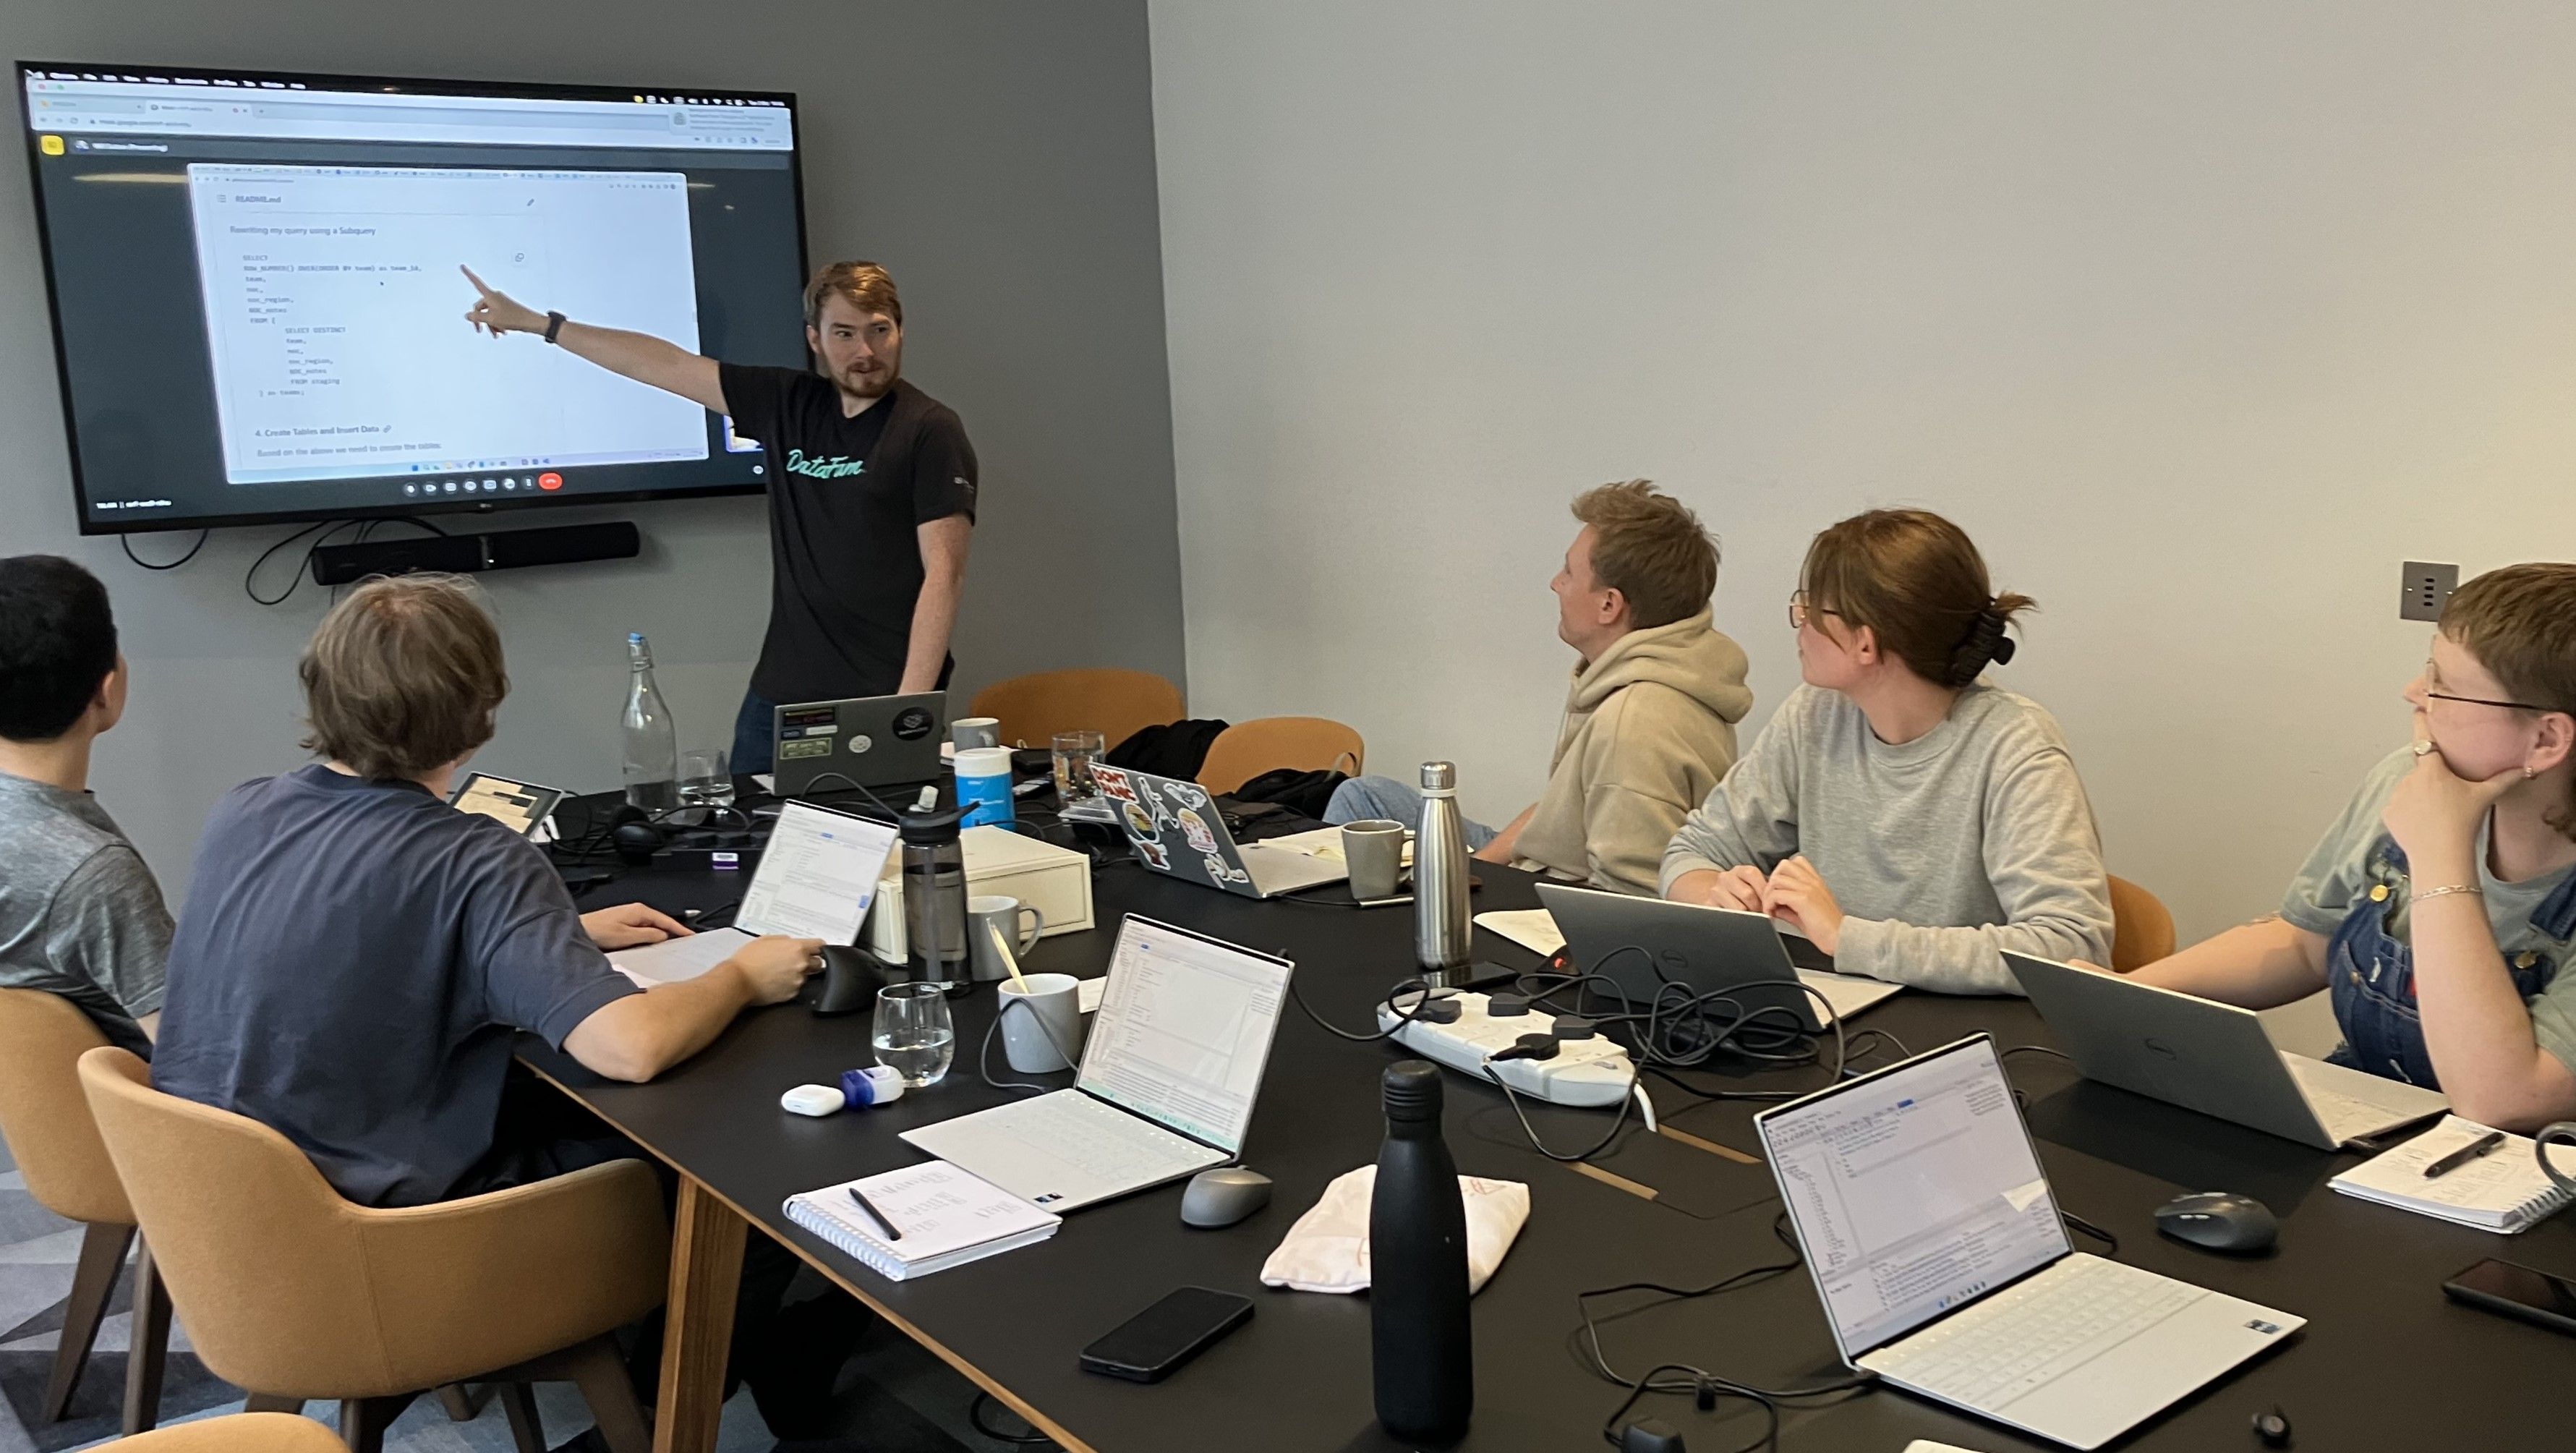
The program has been very rewarding to see participants grow their SQL capabilities and beyond. For me learning SQL was the gateway to learning R and then Python, it's been great to see others follow suit and build their confidence to code. Internally, we have seen the number of monthly active SQL users on our Snowflake account double, and generally, a much more confident team when it comes to SQL.
For those interested in improving their SQL skills from basic knowledge to solving real-world applications, the Summer of SQL offers a pathway to achieve that goal. Whether you're a new analyst looking to accelerate your career or an experienced professional aiming to refine your skills, this program provides the challenges and guidance necessary to build and show off your SQL expertise.
