

15 December 2015
Many people encounter an issue when working with county level data in Tableau - here's why and how to resolve it
Not another UK mapping in Tableau post?! Oh yes. This time we’re having another look at the way UK counties are plotted by Tableau.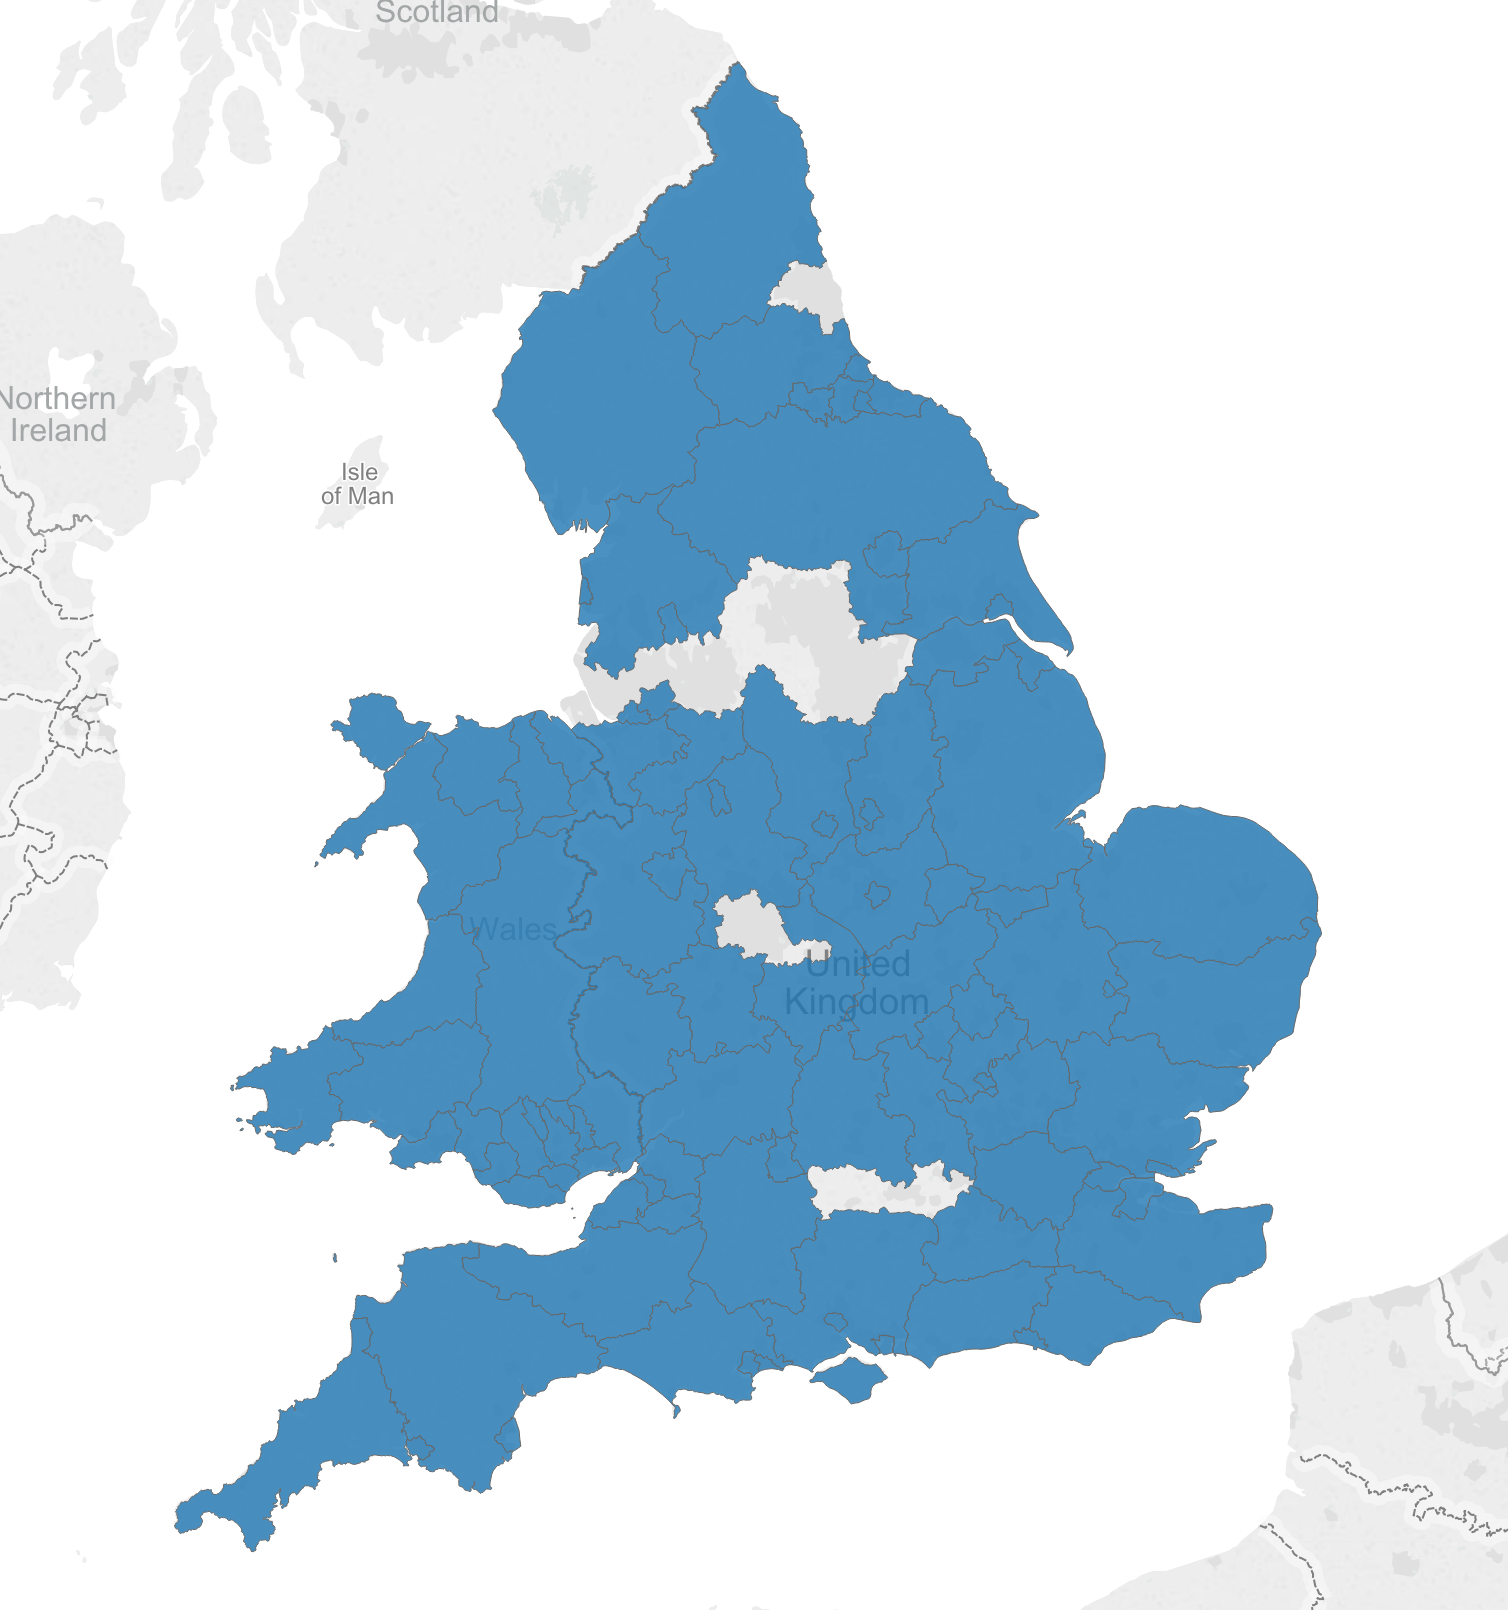 In Tableau version 8.2, our favourite Seattle-based company introduced UK Counties as a native mapping option in Tableau Desktop. This means you can select a dimension from the data pane on the left and assign the ‘County’ Geographic role to it, allowing automatic plotting of your County level data on a map, in either points-on-map / scatterplot style, or in the nice Filled Maps ‘chloropleth’ option.However, many people encounter an issue when working with county level data, whereby some of their counties do not get recognised by Tableau and are therefore left with some weird gaps. Large swathes of the north of England are missing, as well as part of the Midlands and an area just west of London.Part of the problem is the way the UK carves up it’s green and pleasant land into regions and sub-divisions – or rather the MANY ways it seems to do this. Tableau chose one of the several ways to do this, which works well for some, but not for others. The counties that most people seem to miss are• Tyne and Wear• West Yorkshire• South Yorkshire• Greater Manchester• Merseyside• West Midlands• Berkshire
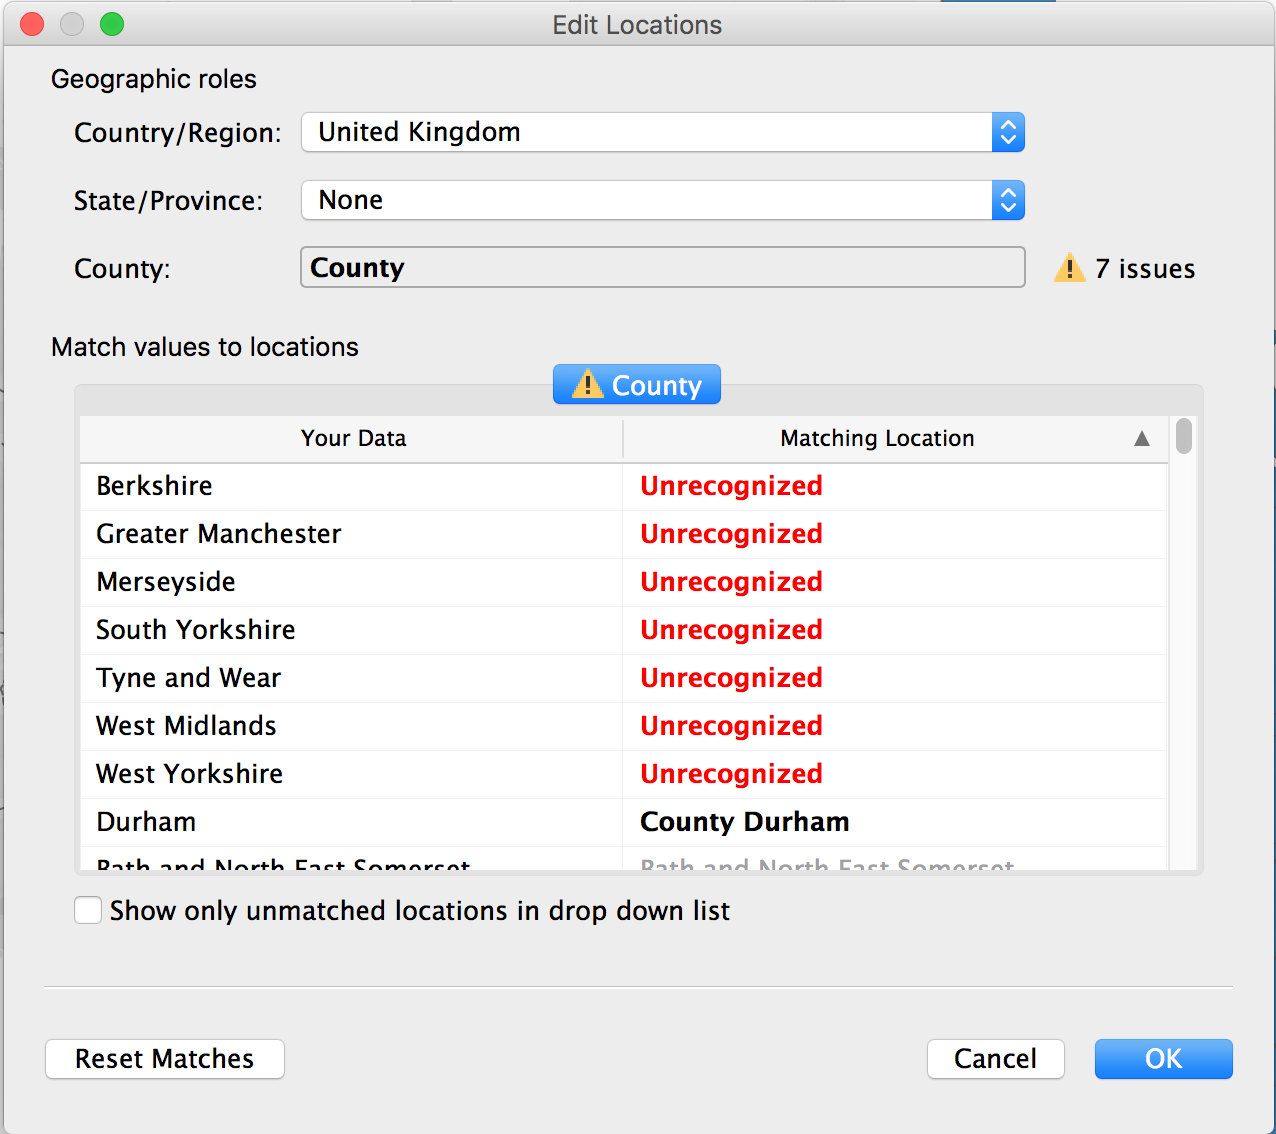 The first 6 in that list are what are called ‘Metropolitan Counties’. Whilst still widely accepted as being part of the official geography classification in England, these counties have no official authority for local government functions – in these areas, there is no County Council and instead the authority is passed to the Metropolitan Borough subdivisions. It is these Boroughs that Tableau will recognise, rather than the county.
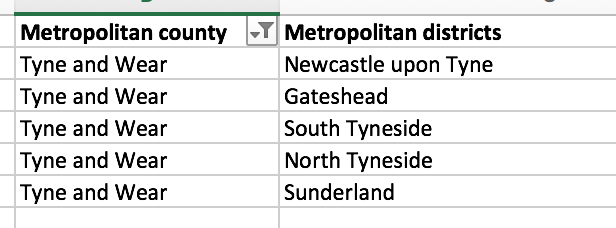 For example, Tyne and Wear is made up of the boroughs Newcastle upon Tyne, Gateshead, South Tyneside, North Tyneside, and Sunderland. You’ll need to ensure you have this lower level of geographical classification to make use of county maps in Tableau.Berkshire is a bit of a special case where it is a non-metropolitan county, but the only one where no County Council exists. In this case, the local government authority is passed to the subdivisions called Unitary Districts – West Berkshire, Reading, Wokingham, Bracknell Forest, Windsor and Maidenhead, and Slough.So, in summary…
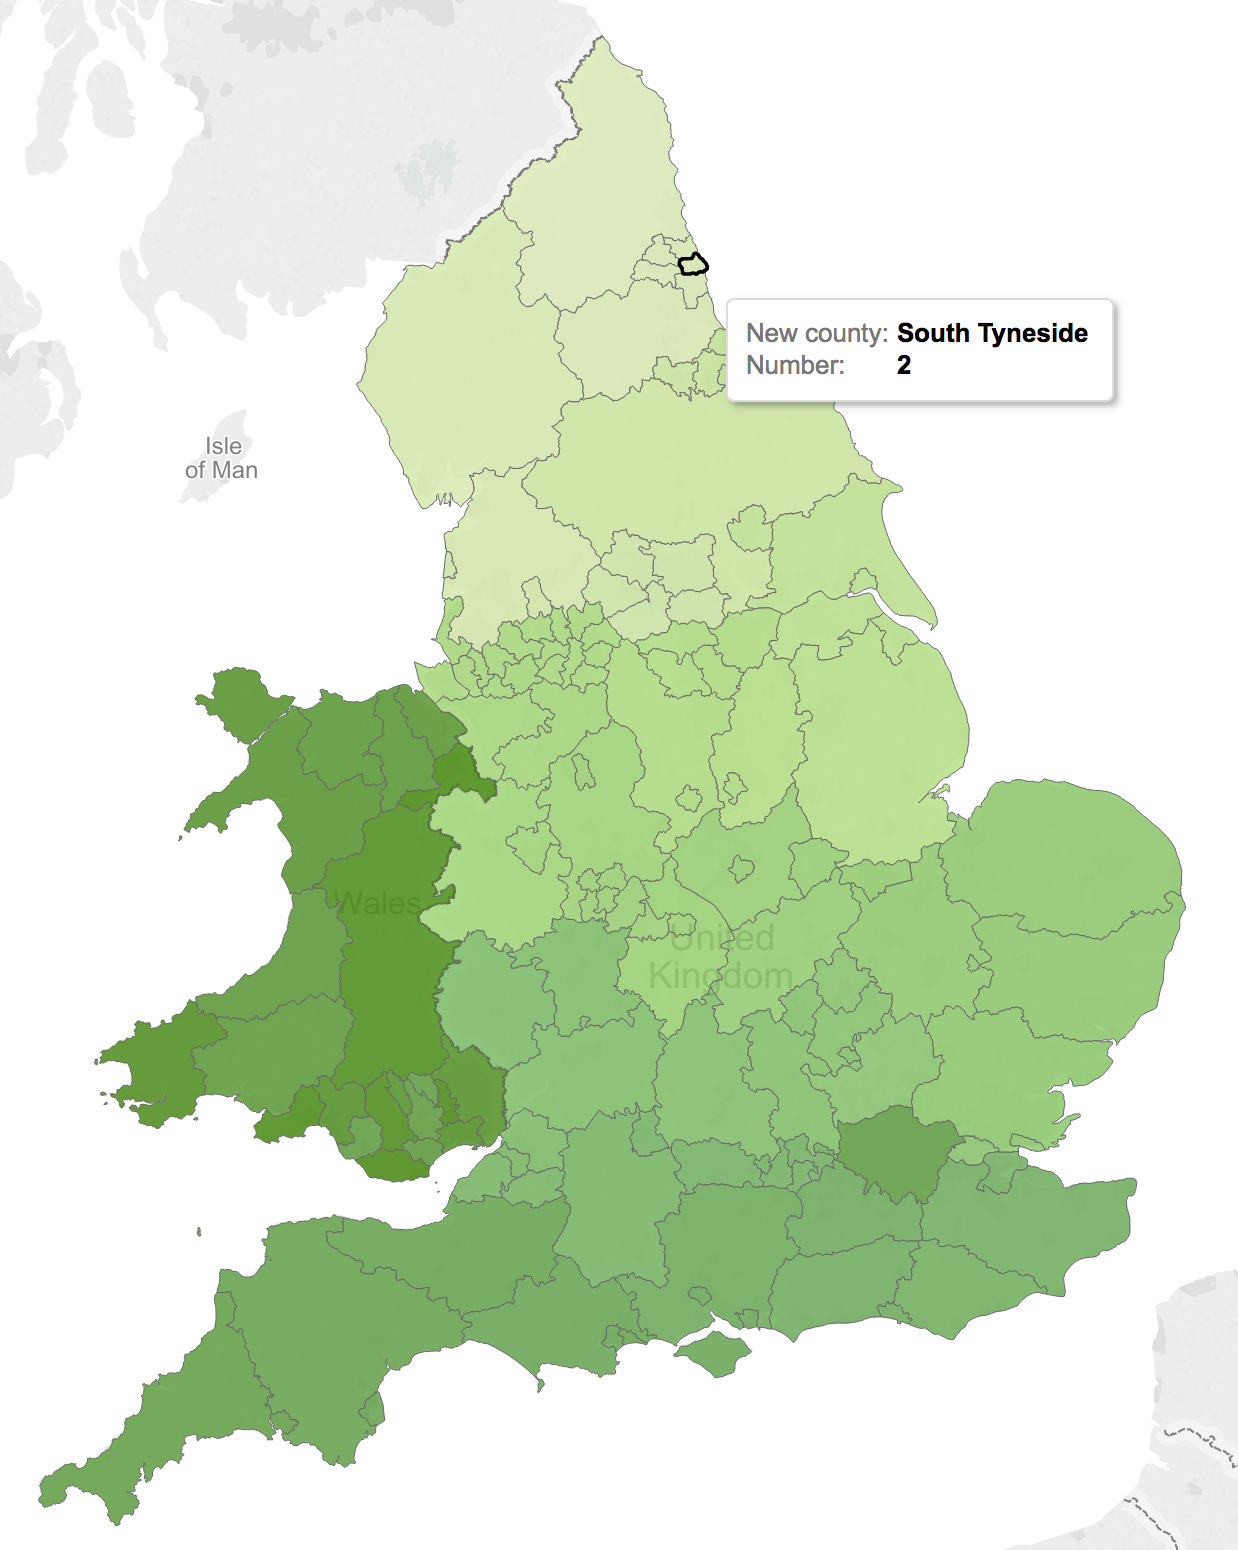
In Tableau version 8.2, our favourite Seattle-based company introduced UK Counties as a native mapping option in Tableau Desktop. This means you can select a dimension from the data pane on the left and assign the ‘County’ Geographic role to it, allowing automatic plotting of your County level data on a map, in either points-on-map / scatterplot style, or in the nice Filled Maps ‘chloropleth’ option.However, many people encounter an issue when working with county level data, whereby some of their counties do not get recognised by Tableau and are therefore left with some weird gaps. Large swathes of the north of England are missing, as well as part of the Midlands and an area just west of London.Part of the problem is the way the UK carves up it’s green and pleasant land into regions and sub-divisions – or rather the MANY ways it seems to do this. Tableau chose one of the several ways to do this, which works well for some, but not for others. The counties that most people seem to miss are• Tyne and Wear• West Yorkshire• South Yorkshire• Greater Manchester• Merseyside• West Midlands• BerkshireThe first 6 in that list are what are called ‘Metropolitan Counties’. Whilst still widely accepted as being part of the official geography classification in England, these counties have no official authority for local government functions – in these areas, there is no County Council and instead the authority is passed to the Metropolitan Borough subdivisions. It is these Boroughs that Tableau will recognise, rather than the county.For example, Tyne and Wear is made up of the boroughs Newcastle upon Tyne, Gateshead, South Tyneside, North Tyneside, and Sunderland. You’ll need to ensure you have this lower level of geographical classification to make use of county maps in Tableau.Berkshire is a bit of a special case where it is a non-metropolitan county, but the only one where no County Council exists. In this case, the local government authority is passed to the subdivisions called Unitary Districts – West Berkshire, Reading, Wokingham, Bracknell Forest, Windsor and Maidenhead, and Slough.So, in summary…- Your data possibly has all the ‘Ceremonial Counties’, which includes areas such as Tyne and Wear, rather than local government authority areas
- Tableau will recognise All Non-Metropolitan counties, except Berkshire but none of the Metropolitan counties
- How do you get around this?
- Change your data to use the next geographic level down for the 7 counties Tableau won’t plot – Unitary Districts or Metropolitan Boroughs
- Put latitude and longitude in the data yourself, although you won’t get the filled map option here
- Use a separate data source and blend – check out tableaumapping.bi for more info
- Wait for the new Tableau features that allow you to use shape files in a workbook, as announced at TC15 in Las Vegas