


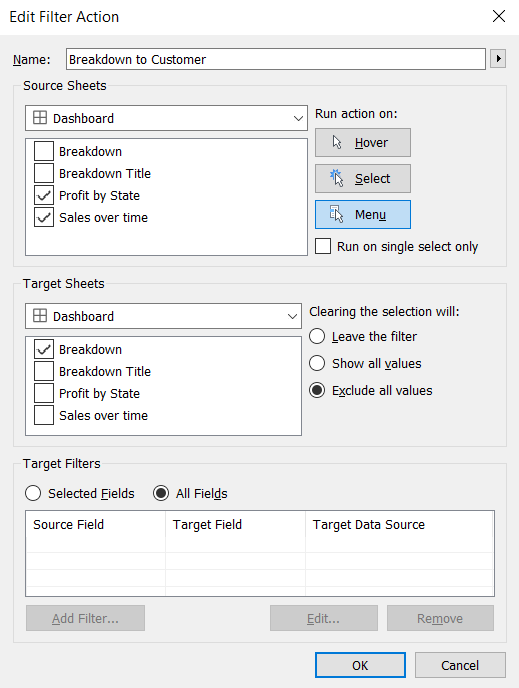
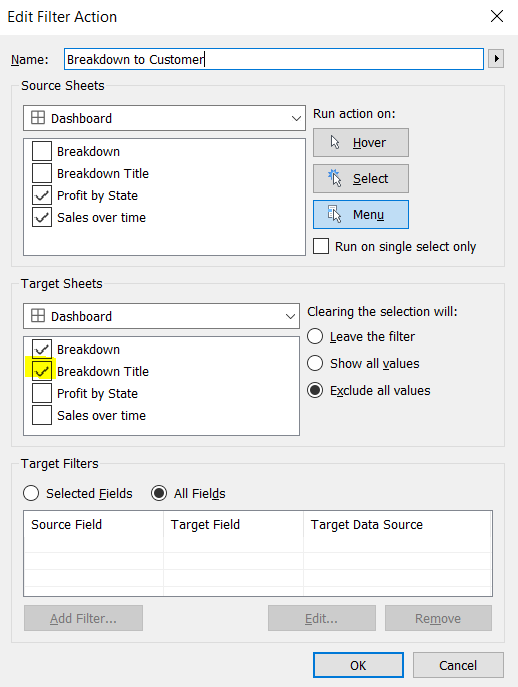
There are often times that I produce dashboards for clients that ask me to breakdown their data further into the lowest level of granularity. I usually achieve this by using the Filter dashboard action as you can see in the Fig. 1 below.
I like to maximise the space that I have in my dashboard and only have the finer details to 'pop up' when the end user would like to see it. And then 'disappear' when they would like to resume viewing the whole dashboard as it was.
This is achieved by using the Exclude all values option in the Edit Filter Action window. So, when I select on a state in the map, or a bar in the right-hand side chart, I would like to have the table with the individual customers and their order details to 'pop up', and then 'disappear' when I click away.
Problem
As mentioned above, I like to make dashboards that have the flexibility to drill down into the data to show more granular detail. I have a sheet that will only appear when the other two sheets in the dashboard filters to view it.
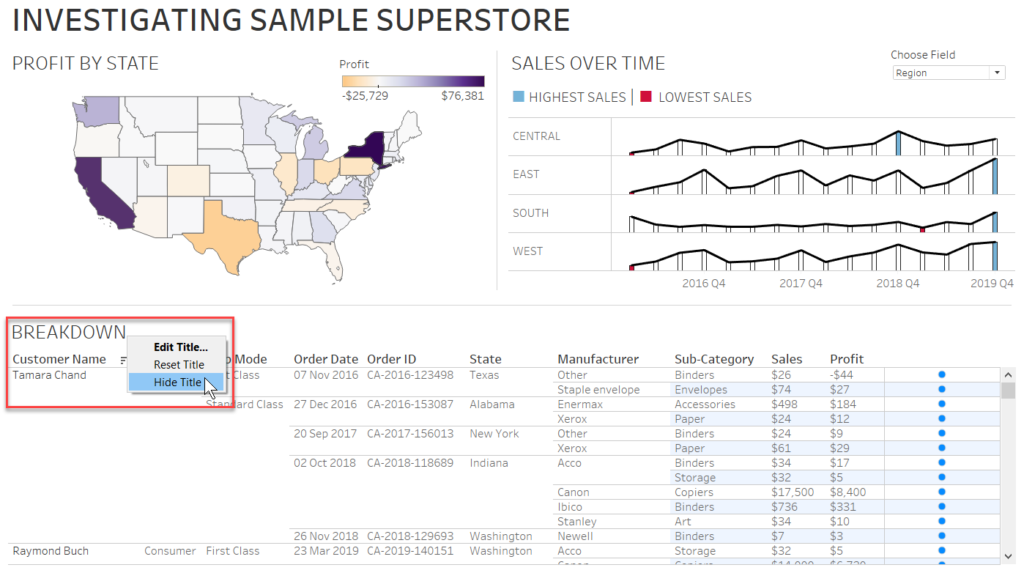
The issue is that when I clear the area to make the granular detail 'disappear', the sheet title remains as seen in Fig. 3 below.
Solution
I could always just hide the worksheet title so it never shows irrespective of whether the dashboard shows the finer details or not.
However, there are some cases where it is important to see the worksheet title. It can be for simple reasons such as 'the stakeholder wants to see the title'.
To make this work, follow the steps below:
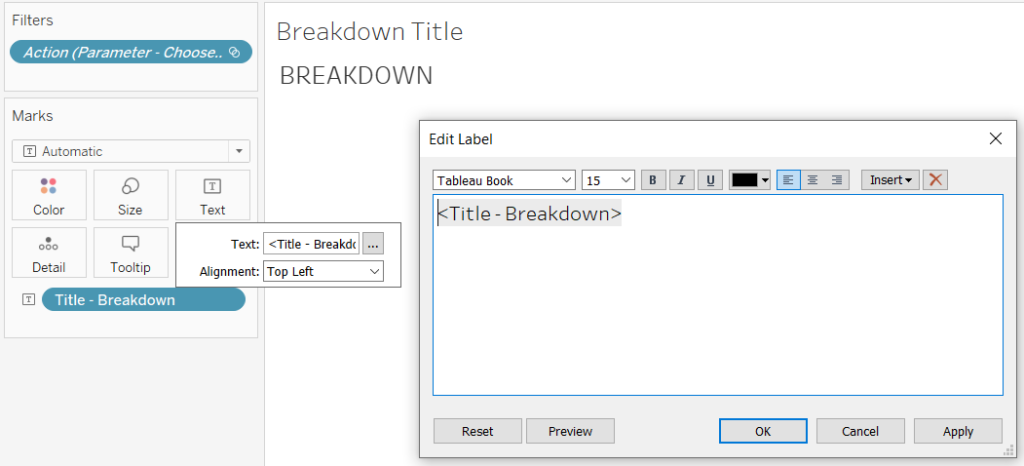
1. Go to the Breakdown worksheet. In the Filters pane you can see the filter action field there. This is the action that was produced in Fig. 2 above.
2. Create a calculated field with that field in the Filters pane as seen in Fig. 6 below.
IF [Action (Parameter - Choose Field,NULL Highlight,QUARTER(Order Date))] = TRUE
THEN 'BREAKDOWN'
ELSE ''
END
The calculated field above will display the BREAKDOWN text when the filter dashboard action is enabled. When the end user clicks off and disables the dashboard action, the calculated field will display a blank entry essentially making the text 'disappear'.
3. Make a new worksheet and put the new calculated field [Title - Breakdown] onto the Text card in Marks pane.
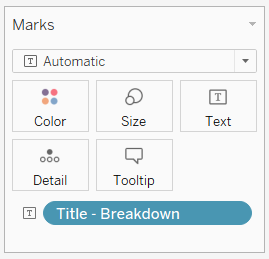
4. Make the desired formatting. In my case, I have made the text formatting font to Tableau Book and size 15.
5. Now, go to your dashboard. Hide the sheet title of the worksheet with the breakdown values.
6. Add in the worksheet with the Title - Breakdown field on the dashboard just above the breakdown sheet.
7. Update the filter action configuration from Fig. 2 to check the new worksheet that has been added in. This is so that that [Action (Parameter - Choose Field,NULL Highlight,QUARTER(Order Date))] field can appear in the filter pane of that worksheet for it to work.
All set! The dashboard should work accordingly with the breakdown title only appearing when the end user chooses to view the granular information.
If you would like to see how this dashboard was built then you can visit this link and download the workbook.
I hope you found this useful. Feel free to let me know what you think in the comment section below.