

During my recent client assignment, I was asked to develop a dashboard for monitoring REST API calls on Tableau server. Admins wanted to make sure that the person that was permitted access via REST API was only doing what was included in the project scope - in this case downloading workbooks as .pdf - and nothing else.
After some initial research I have split work into 3 phases:
- Learning what REST API is and how to use it. Trying to download .pdf from the server using REST API
- Learning about Logshark and running it on server Logs
- Creating a dashboard based on Logshark output
Part 1 - Learning what REST API is and how to use it. Trying to download .pdf from the server using REST API:
With the Tableau Server REST API you can access, manage and change Tableau Server resources programmatically.
If you know Python you can use Tableau Server Client:
https://tableau.github.io/server-client-python/#
Or much more user friendly: Postman. As a first step download Postman from here:
https://www.postman.com/downloads/
Postman is basically sending URIs to Tableau server so that your job is to construct them in a way that Tableau will understand. It is very clearly documented how URIs should look like. Your job is as simple as filling in the gaps and sending them!
The first step is basically using URI to log in and then using the returned token for all following requests - it will be valid for 2 hours.
URI
template
POST https://MY_SERVER/api/api-version/auth/signin
example
POST https://tableauserver.co.uk/api/3.8/auth/signin
Note:
Api version for 2020.2 is 3.8, check yours here
BODY
template
<tsRequest>
\t<credentials name='user-name' password='password'>
\t\t<site contentUrl='my-site-name' />
\t</credentials>
</tsRequest>
example
<tsRequest>
\t<credentials name='wiktoria.rudz' password='xxxxxxxx'>
\t\t<site contentUrl='Dump' />
\t</credentials>
</tsRequest>
You will get this response, which includes your token to paste in further requests:
RESPONSE
<?xml version='1.0' encoding='UTF-8'?>
<tsResponse xmlns='http://tableau.com/api' xmlns:xsi='http://www.w.org/2001/XMLSchema-instance' xsi:schemaLocation='http://tableau.com/api http://tableau.com/api/ts-api-3.8.xsd'>
<credentials token='zxwoUmMQqmGTh2Xfsfg|AOeNhrP9FDeorV3L1szTOgyNb4OU0IU'>
<site id='55518117-e4a3-42e4-99-48ad0f9ff9a' contentUrl=''/>
<user id='f65eaec9-758-be5-bf5-a9024a243b'/>
</credentials>
</tsResponse>
Great now that we’re in we should be able to just download the .pdf. Unfortunately if you look at the .pdf download URI you will notice that there is a workbook id we need to fill it in with
GET /api/api-version/sites/site-id/workbooks/workbook-id/pdf?type=page-type&orientation=page-orientation
You can skim through this tutorial to get an idea for what’s possible:
https://help.tableau.com/current/api/rest_api/en-us/REST/rest_api_get_started_tutorial_part_1.htm
This list of all call methods is particularly useful
https://help.tableau.com/current/api/rest_api/en-us/REST/rest_api_ref.htm
I don’t know if that’s the best way but here are the steps I took to find a workbook-id.
First I used site ID to query site for projects…
template
GET /api/api-version/sites/site-id/projects
example
https://tableauserver.co.uk/api/3.8/sites/55518117-e4a-4e4-9549-49ad0f6f8a/projects
RESPONSE
<project id='0ffc890-ac9-4d66-bc3-b8d5e773df' name='Wiktoria testing Logshark' description='' createdAt='2020-06-01T10:08:22Z' updatedAt='2020-06-01T10:08:22Z' contentPermissions='ManagedByOwner'>
<owner id='f657ea9-7a58-be5-bf05-a60224a23b'/>
…..then I was thinking if I query the project, I will be able to get the ID for the workbook, but this and a couple of similar attempts we unsuccessful for me until I just looked at recently viewed:
template
/api/api-version/sites/site-id/content/recent
example
https://tableauserver.co.uk/api/3.8/sites/5558117-e4a6-42e7-954-48adf6f9a/content/recent
SUCCESS
RESPONSE
<?xml version='1.0' encoding='UTF-8'?>
<tsResponse xmlns='http://tableau.com/api' xmlns:xsi='http://www.w3.org/2001/XMLSchema-instance' xsi:schemaLocation='http://tableau.com/api http://tableau.com/api/ts-api-3.8.xsd'>
<recents>
<recent>
<workbook id='83c2b707-b71-4e32-886f-17a84619a6' name='Profitability Good' description='' contentUrl='ProfitabilityGood' webpageUrl='https://tableauserver.co.uk/#/workbooks/7745' showTabs='true' size='1' createdAt='2020-06-01T10:10:27Z' updatedAt='2020-06-01T10:10:27Z' encryptExtracts='false' defaultViewId='8d20fb3c-fc5-4703-803-9f1e913eb1'>
<project id='0ffcd90-ac29-4d66-bc3-b8d5ecd773df' name='Wiktoria testing Logshark'/>
<owner id='f65eec9-7a58-4be5-b05-a9028a243b' name='wiktoria.rudz'/>
<tags/>
<dataAccelerationConfig accelerationEnabled='false'/>
</workbook>
</recent>
</recents>
</tsResponse>
Now, I can finally download the PDF
template
GET /api/api-version/sites/site-id/workbooks/workbook-id/pdf?type=page-type&orientation=page-orientation
example
GET https://tableauserver.co.uk/api/3.8/sites/5551817-4a3-44-9549-48ad09f6f9a/workbooks/83c3b7-bd71-4e2-886-177684618a6/pdf?
Voila!
Part 2 - Learning about Logshark and running it on server Logs
This project’s goal was to build the dashboard that allows monitoring of Tableau Server REST API calls. Naturally, the first question to ask is where do I find the data for this? Is it in Postgres? Is it in logs?
REST API calls are registered in Tableau Server Logs as per Tableau documentation


The first thing to do is to download the logs. It is well explained here how to use Tableau Server Management in order to generate a snapshot here:
https://help.tableau.com/current/server/en-us/logs_archive.htm
Don’t unzip the logs.
Instead of trying to parse the Logs and being completely lost about what to look for, I decided to use Logshark first. Logshark generates some dashboards and datasets automatically, so I was curious if they will be of any use to me.
Download and unzip Logshark. No need to actually install it. For clarity, I put logs and Logshark in one location.
https://tableau.github.io/Logshark/docs/logshark_install
Follow the instructions, especially for PATH and running Command Prompt as an administrator.
Open Command Prompt from the Start menu. Run the following command:
template
LogShark <LogSetLocation> <RunId> [Options]
example
“LogShark C:\\Users\\Wiktoria\\Desktop\\Logshark\\ziplogs.zip Run01”
Files should now being analysed. It might take some time depending on how large the logs are.
Logshark will create an Output folder with pre-generated dashboards and .hyper datasets.
We will use that as a base for further analysis. As mentioned before, REST API logs are stored in Vizportal folder. That’s how the dashboard of our interest is called:

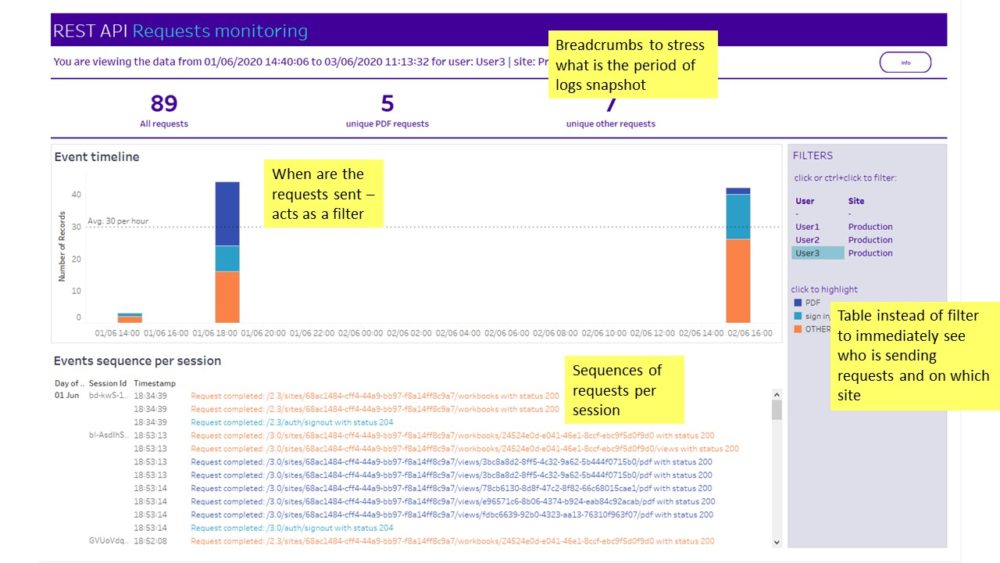
Part 3 - Creating a dashboard based on Logshark output
The Vizportal Workbook from Logshark primarily displays data for all administrative tasks on the server and as default looks like this:

Our task is to differentiate REST API calls from all other calls.
When taking a closer look at the dataset, we can see that the value in the Message field is very similar to the URI we initially constructed
Message field value:
“Request completed:
/3.0/sites/68ac1484-cff4-44a9-bb97-f8a14ff8c9a7/views/409c9924-91b0-4e19-a10e-dd4d297d7992/pdf with status 200”
Our initial .pdf download URI from part 1 of this post:
GET https://tableauserver.theinformationlab.co.uk/api/3.8/sites/5551817-e4a3-4e4-9549-48a0f9f69a/workbooks/83cb70-bd71-4e22-886f-170a86189a6/pdf?
We can see that in order to identify REST API calls we might simply look for API versions in the string. I created a calculated field with regex as below and applied it in Tableau as a data source filter set to: TRUE.
REGEXP_MATCH([Message],'\\/\\d\\.\\d\\/')
Now our dataset is purely REST API calls - at least that’s what I think - please let me know if you have an idea on how to do it differently!
The next step is to flag PDF downloads and whatever other calls we are interested in. For this purpose, we need to revisit a webpage with all methods available
https://help.tableau.com/current/api/rest_api/en-us/REST/rest_api_ref.htm
Then look for ones we are interested in and then look for similar keywords in the Message field with the formula. In my case, I have written down the following formula, as the client was most interested to see if there were any unauthorised uploads and downloads.

IF CONTAINS([Message],'pdf') then 'PDF'
elseif CONTAINS([Message],'/databases/') then 'Database operations'
elseif (CONTAINS([Message],'/workbooks?overwrite') or CONTAINS([Message],'/workbooks?skip')
or CONTAINS([Message],'/workbooks?upload')) then 'Workbook upload'
//looks for different upload URI but if URI is plain PUT (...) workbook it will be returned in yellow as 'OTHER'
elseif (CONTAINS([Message],'/signout') OR CONTAINS([Message],'/signin') ) then 'sign in/out'
elseif (CONTAINS([Message],'/datasources?overwrite') or CONTAINS([Message],'/datasources?append')
or CONTAINS([Message],'/datasources?upload')) then 'Datasource upload'
//looks for different upload URI but if URI is plain PUT (...) datasources it will be returned in yellow as 'OTHER'
elseif REGEXP_MATCH([Message], '\\/workbooks\\/.*\\/content') then 'Workbook download'
elseif REGEXP_MATCH([Message], '\\/datasources\\/.*\\/content') then 'Datasources download'
//need to use regex as only looking for 'workbooks'/'datasources' in URI together with 'content' give us certainty its a download URI
else 'OTHER' END
There is one problem with this approach. In the message field we don’t receive information about what type of HTTP verb was used to describe the action being requested.
GET (read information)
POST (create new resources)
PUT (update existing resources)
DELETE (remove resources or configurations)
This is particularly troublesome in the following example:
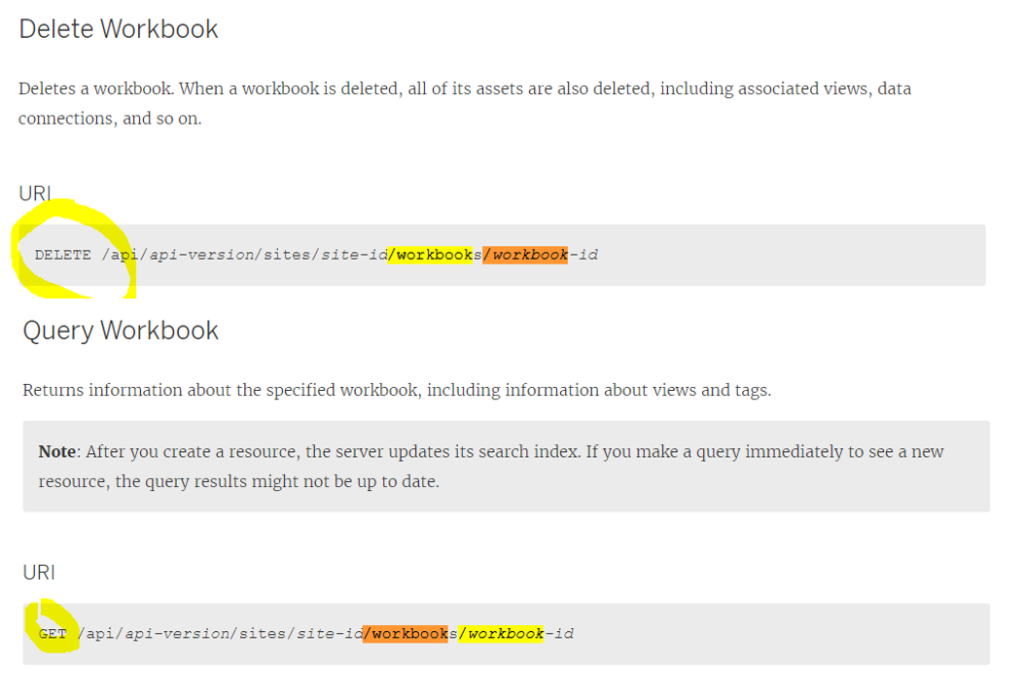
It is useful to monitor such calls in a sequence where they occurred to have more context - I reflected it in the second chart on my dashboard.
I didn’t get to the bottom of it eventually, so I can’t confirm whether the HTTP verb is included in logs at all. In order to troubleshoot it, it would be best to have a peek at REST API requests coming in live and see how they’re registered in logs.
In command prompt go to location
/var/opt/tableau/tableau_server/data/tabsvc/logs/vizqlserver
Then run the 'tail -f nameoflogfile' command
Then make a REST API call to see how it comes through.
Then look for a pattern in logs and parse them directly rather than using Logshark. Going with Logshark could be annoying if you would like to refresh the dashboard frequently and don’t have an engineer who would be able to help to automate the process.
And that’s how the dashboard looks like:

And this is a sample on Tableau Public:
Thanks for reading!