


At the recent Tableau conference there was a lot of talk around the Salesforce product Einstein and how this is starting to be integrated into some areas within the Tableau product range. Salesforce and Tableau have allowed users to bring all of their data together by combining Einstein Analytics and Tableau to form Tableau CRM.
Tableau + Einstein = Tableau CRM
This series of blogs is going to focus on comparing the similarities and differences between the data preparation aspects of both products - Tableau Prep and Einstein Analytics. The key areas that I will focus on are:
- Input - How do you connect to data?
- Investigation - Getting to know the data and if there are any problems
- Cleansing - Cleaning the data with filters, calculations and string manipulation
- Combining - Joining and unioning the data
- Output - How can you get the data after you’ve finished?
Part 1 of the series is going to focus on The Products, Inputs, & Investigation.
The Products?
Tableau Prep
“Tableau Prep Builder is a tool in the Tableau product suite designed to make preparing your data easy and intuitive. Use Tableau Prep Builder to combine, shape, and clean your data for analysis in Tableau.” - Tableau Website
Einstein Analytics
“Salesforce Einstein Analytics is a cloud-based platform for connecting data from multiple sources, creating interactive views of that data, and sharing those views in apps. Einstein Analytics is a better way to distribute insight to business users so they can understand and act on changing information.” - Salesforce Website
So, on the surface these look like fairly similar products with both allowing users to clean and transform their data so it can be used for analysis and insight at a later stage. Tableau have split their products into two - Tableau Prep for the data preparation, and Tableau Desktop for the insights. Whereas, Salesforce has combined both into a single product called Einstein Analytics, with a data layer and analytics dashboards.
Input
Tableau Prep
There are three different types of data source that you can connect to:
- Tableau Server - Data source publish to a Tableau Server
- Files - including Excel, CSV, Tableau Extract, & PDFs
- Server - around 50 different connectors, including Microsoft SQL server, Google Drive, & Salesforce
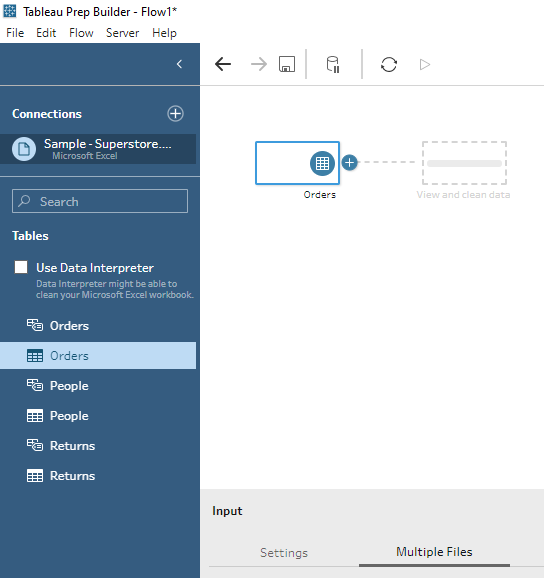
These are easy to connect to via the connection pane:
After you’ve selected your connection, you can bring this into the workflow by dragging and dropping the table from the blue menu on the left hand side.
Einstein Analytics
You can also connect to various different data sources with Einstein, but with more of a Salesforce focus. When you first create a dataset you have the following options:
- CSV File - this is the only file type that can be used
- Salesforce Data - connects to related Salesforce Objects
- External Data - 25 different connectors including Redshift, Microsoft Dynamics CRM & Marketo
- Datasets - previous datasets that have already been created
Once you have selected the data that you want to connect to, you can then create a Dataflow or Recipe. These aren’t mutually exclusive, so for example you can create a Dataflow which can be used later within a Recipe.
The main features of each are:
Recipe
- Preview data
- Remove or change columns
- Smart suggestions on how to improve your data
- Bucket values and create calculations
- See a history of your changes
Dataflow
- Design preparation flows
- Edit underlying JSON
- Perform calculations and filters
More information here on the Salesforce website.
Dataflow
There are various different input options for the Dataflow:
- sfdcDigest - Generates a dataset based on a Salesforce Object
- Digest - extract data from an external Salesforce org
- Edgemart - connects to an existing dataset. This can contain Salesforce data, external data or a combination of both.
To open any of the input connections, you just need to click on the tool and this will be added to the canvas:
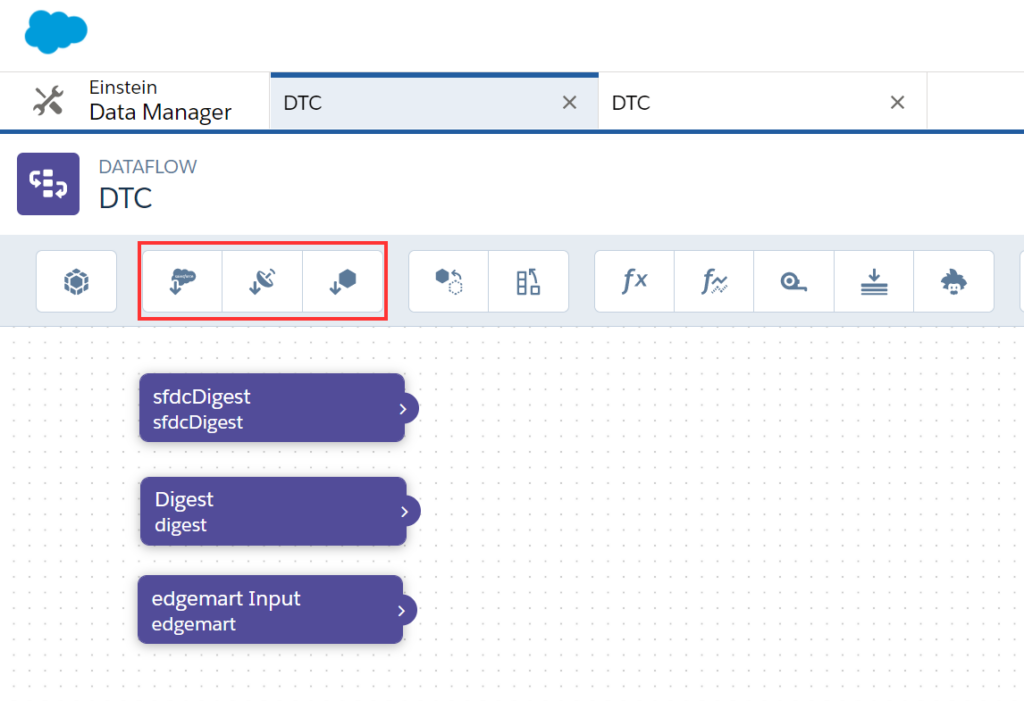
Each tool will have a separate setup as well so find out more information about the setup of each on the Salesforce website.
Recipe
To input the data into a recipe, all you have to do is locate the dataset in the Einstein Analytics Studio and then select ‘Create Recipe’ from the dropdown.
Investigation
Now we have input our data, we want to take a look and see if there is anything unexpected or something that we have missed. Within the investigation stage, I want to know how each of the tools help me to learn something about my data set.
Tableau Prep
After you have input the data into a Tableau Prep workflow, you are prompted to ‘View and Clean Data’ by adding a clean step after the input.
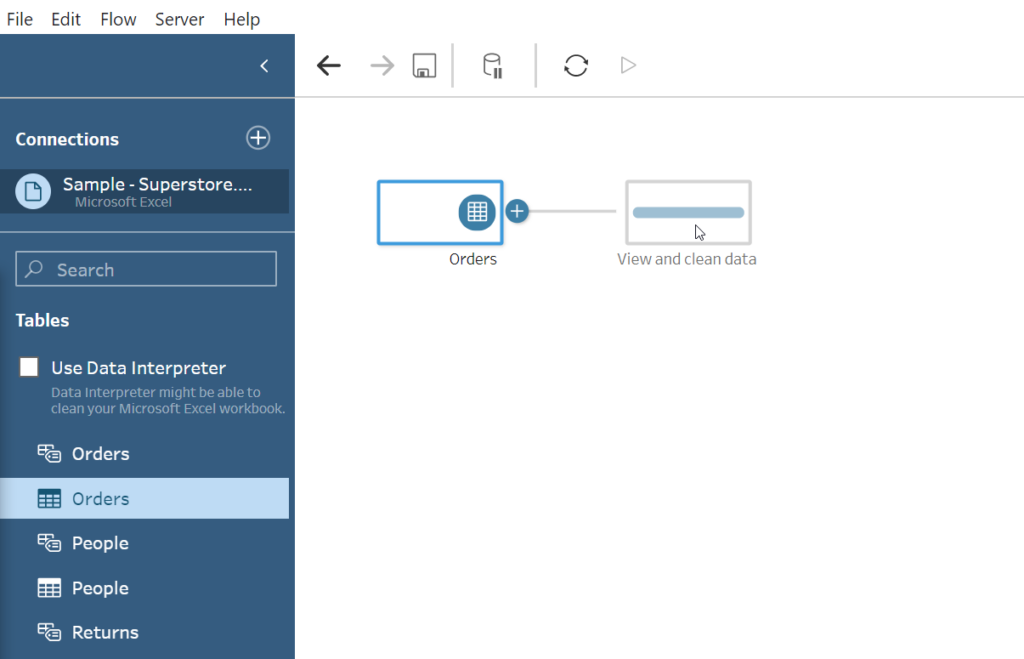
Within the ‘Clean’ step, the profile pane interface allows you to view all of the fields within your dataset. The distribution of the values in each field are shown with bar charts which will filter the data as you click on a value. You can see a breakdown of the rows of data within the Data Pane at the bottom of the screen.
Tableau Prep also suggests some ‘Recommendations’ on ways to clean and improve your data.
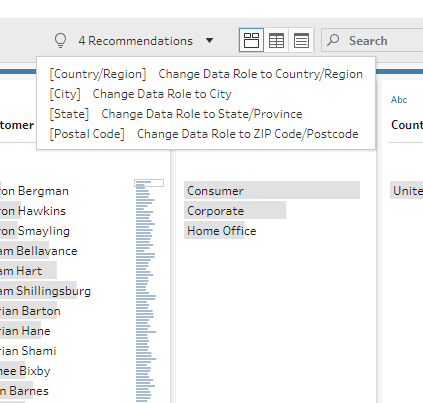
Although Tableau Prep doesn’t give you an in-depth investigation of your data, it allows you to easily identify potential problems with a nice visual interpretation.
Einstein Analytics
Einstein is a little different in this section, as it doesn’t really have the investigation tools compared to Tableau Prep. Again, let's split it out into Recipes & Dataflows:
Dataflow
A data flow doesn’t have a view of what data is in each of the inputs, only a view on which fields are included:
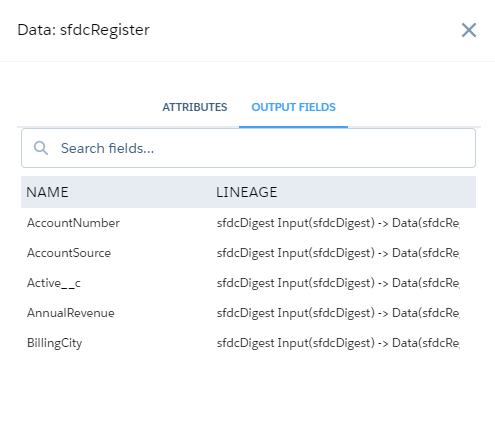
In order to view the values that are included, you will need to do some exploration within a ‘Lens’ which is the same place as where you create your charts and visuals. This isn’t ideal if you don’t already have an understanding of the data being transformed.
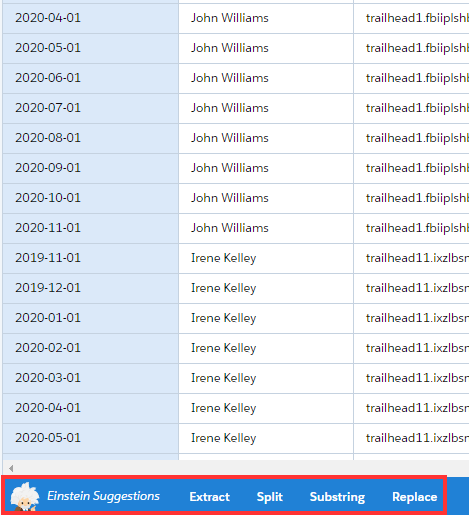
Recipe
When creating a new recipe, you get to see a preview of the fields and values involved in the form of a data table. You also get a ‘Field Profile’ on the right hand side when selecting a field. This provides you with information about the distribution of values and also if there is any missing data.
Similar to Tableau Prep, there is also a suggestions/recommendations provided by Einstein which is located at the bottom of the data table:
That's all for the first part of this blog series. Within the next part I will focus on how you can Cleanse data in both of the tools!
Hopefully you have a bit of an understanding about how Tableau Prep and Einstein compare and how they can come together in the future.
If you're interested in learning more about Tableau and Salesforce then please get in touch via info@theinformationlab.co.uk!