

26 September 2014
I'm on a personal quest at the moment to find cool things about functions of Tableau that I might not use as much as others. Date parameters are just one example. I know that they exist, I kind of know what I can use them for, but maybe I don't often get chance to use them, or use an alternative to them (date quick filters anyone?).In this post I'm going to show you four uses for date parameters. Then I'll let you decide what they're good for.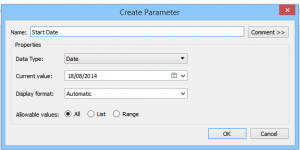 Start Date[/caption][caption id='attachment_3654' align='aligncenter' width='300']
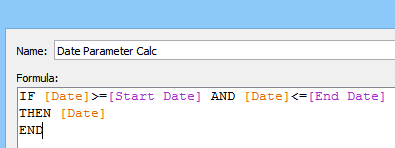
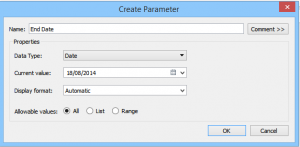 end date[/caption]Then we use these parameters in a calculated field based on our date:
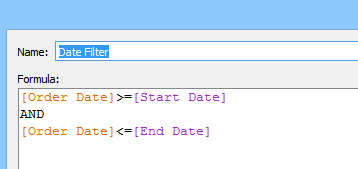 This creates a boolean true or false. Place this on the filter shelf and select 'true' to display only dates within the start and end date parameter selections.
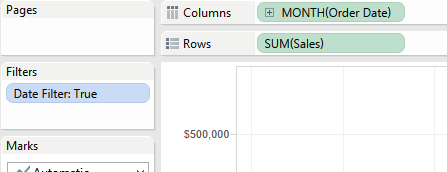 Replicate this in the Coffee Chain data source replacing Order Date with Date. I created sales over time for each data source.
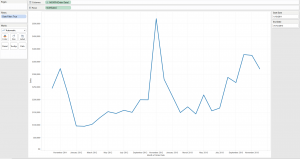 Now if we place these on to a dashboard we only need to show the start and end date parameter controls and both charts will change.
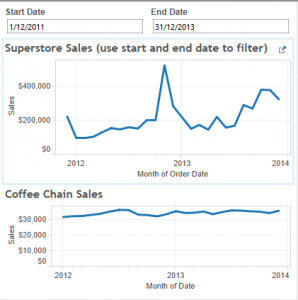
 This calculation will now give you the sales for records within the start and end date. You haven't got the start and end date on the filter shelf, so if you still wanted to display Sales for the entire dataset, you could do.
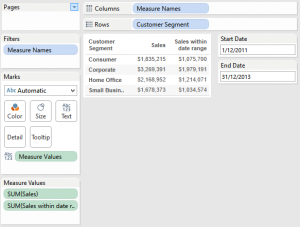
 Now if I set my parameter start date and end date to longer than 12 months my date parts are quarters:
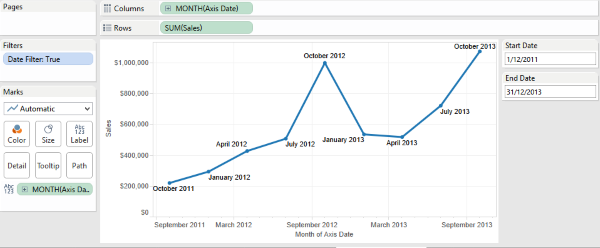 And if I set it to less than 12 months apart we get months:
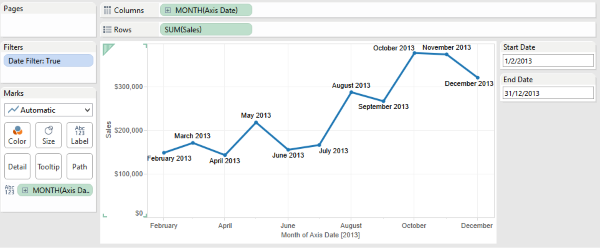 You could potentially go even further and go down to smaller levels: if the date difference is less than a month, show week;less than a week, show days. The only thing you have to do is make sure that the date part of the pill in the view is set to the LOWEST date level you are using (months for months, weeks for weeks etc).
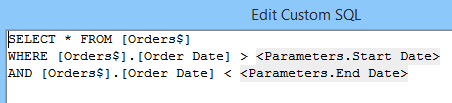 Now, if our start or end date parameters change, so will our data.
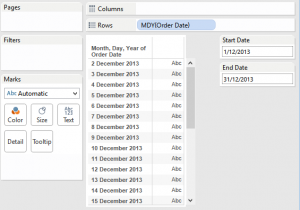 I'm sure there are many other great uses for date parameters out there. If you have used any, feel free to leave a comment below. We love hearing about cool things you've done with Tableau.Download the workbook with all the examples.
Creating Start and End Date Filters across Multiple Data Sources
In this scenario we have two data sources both with different date fields. We want to display charts from both data sources on one dashboard. If we use a quick filter on date we would have to display two date filters on our dashboard - one for each data source. However, by using the date parameter option we could have one control for both chart types. Here's how it's done:I've connected up to both the Superstore Sales subset and the Coffee Chain sources. Then we create two parameters: one for start date; one for end date. Use the images below as a guide:[caption id='attachment_3646' align='aligncenter' width='300'] Start Date[/caption][caption id='attachment_3654' align='aligncenter' width='300'] end date[/caption]Then we use these parameters in a calculated field based on our date:This creates a boolean true or false. Place this on the filter shelf and select 'true' to display only dates within the start and end date parameter selections.Replicate this in the Coffee Chain data source replacing Order Date with Date. I created sales over time for each data source.Now if we place these on to a dashboard we only need to show the start and end date parameter controls and both charts will change.Using Date Parameters within Calculations
You can also use the start and end date parameters within calculated fields. This can be useful if you don't want to add the true/false filter we created on to the filter shelf. But instead want to do the filtering within the calculation.This calculation will now give you the sales for records within the start and end date. You haven't got the start and end date on the filter shelf, so if you still wanted to display Sales for the entire dataset, you could do.Dynamic Date Axis on a chart using Date Parameters
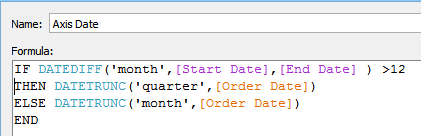
Here's an interesting query I was given recently: If my date ranger is greater than one year, then I want my date axis to be quarterly. However, if my date range is less than one year then I want the axis to show months. Here's how I did it:Created a calculated field using some nifty date functions DATEDIFF() and DATETRUNC().Now if I set my parameter start date and end date to longer than 12 months my date parts are quarters:And if I set it to less than 12 months apart we get months:You could potentially go even further and go down to smaller levels: if the date difference is less than a month, show week;less than a week, show days. The only thing you have to do is make sure that the date part of the pill in the view is set to the LOWEST date level you are using (months for months, weeks for weeks etc).Using Date Parameters in Custom SQL:
Here's another use for our start and end date parameters. Say I only want to bring back data within my start and end dates. Well then we can use our date parameters in Tableau's custom SQL connection:Now, if our start or end date parameters change, so will our data.I'm sure there are many other great uses for date parameters out there. If you have used any, feel free to leave a comment below. We love hearing about cool things you've done with Tableau.Download the workbook with all the examples.