

1 May 2015
In this post we divert from the daily, technical aspects of using Tableau and rather take a helicopter view to see Tableau's connection to corporate, organisational analytical and decision making capabilities.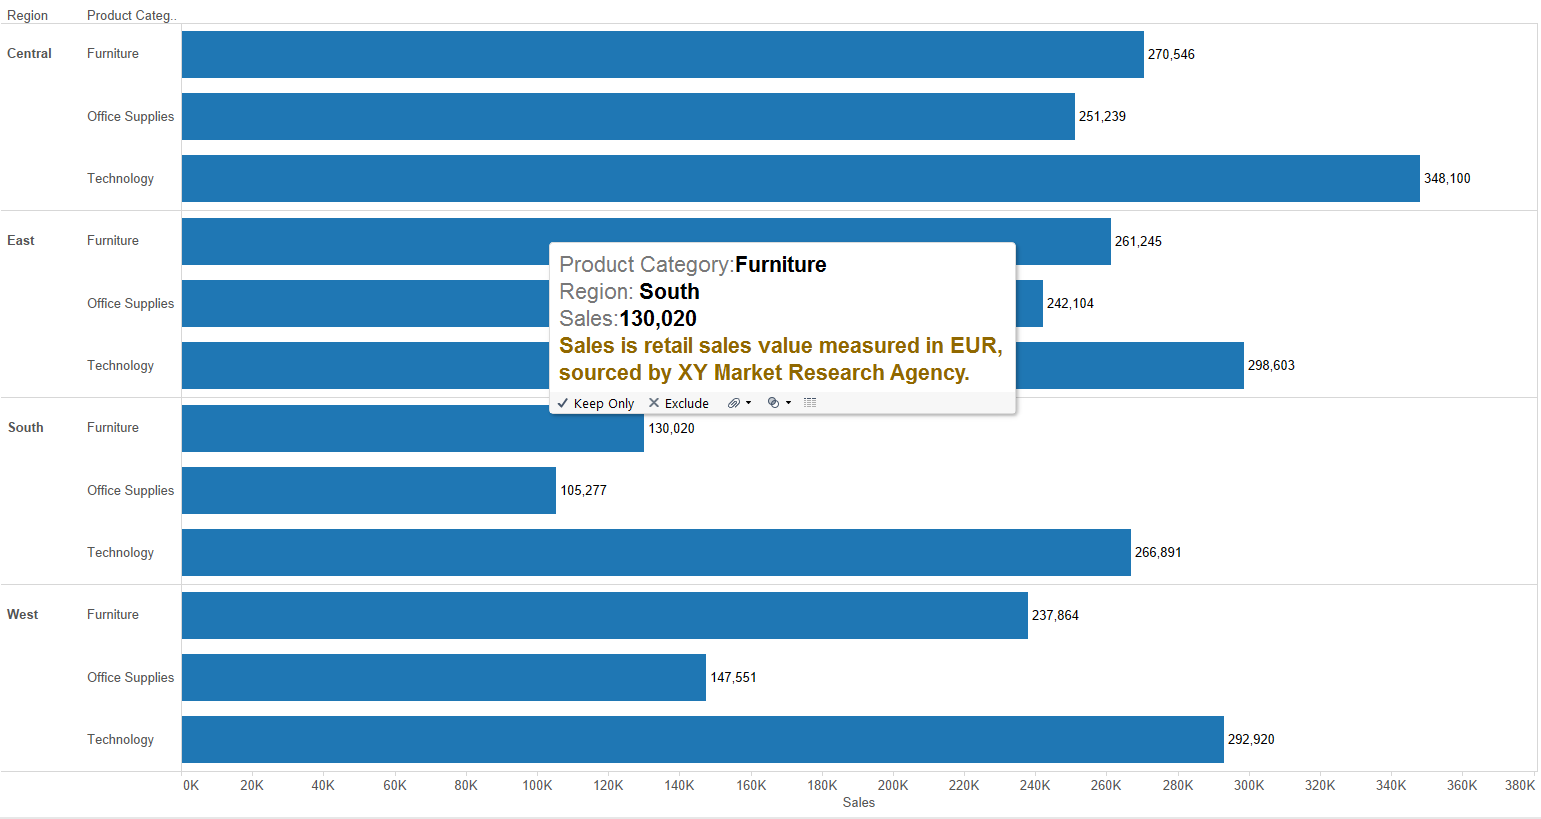 - give information on data recency and source (what if market share is measured by two possible methods and users can confuse the two if it is not told). This may be the small text at the corner of the dashboard ('Data last refreshed on ...') or included on a separate 'Help' page.- design an effective analytical journey in the dashboard. This task often precedes even opening Tableau.
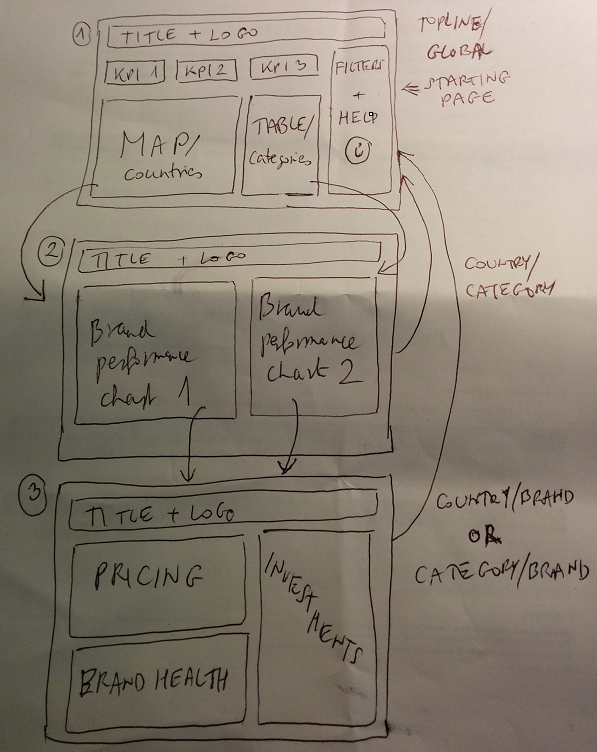 - have call to action triggers if necessary (e.g. 'Select a Product to narrow down the analysis', 'Click on a Country to update all charts', 'Use the zoom controls on the top left to navigate on the map')- lead the user around the dashboard (e.g. add ordered titles to quick filters and parameters: '1. Select a Category', '2. Select a Product', '3. Select a KPI')- involve business stakeholders with no IT knowledge in the testing phase and discuss how they use the report, do they find what they are looking for, etc.- it may even be worth organising user trainings where user groups walk through the dashboard with the help of a 'champion' end user
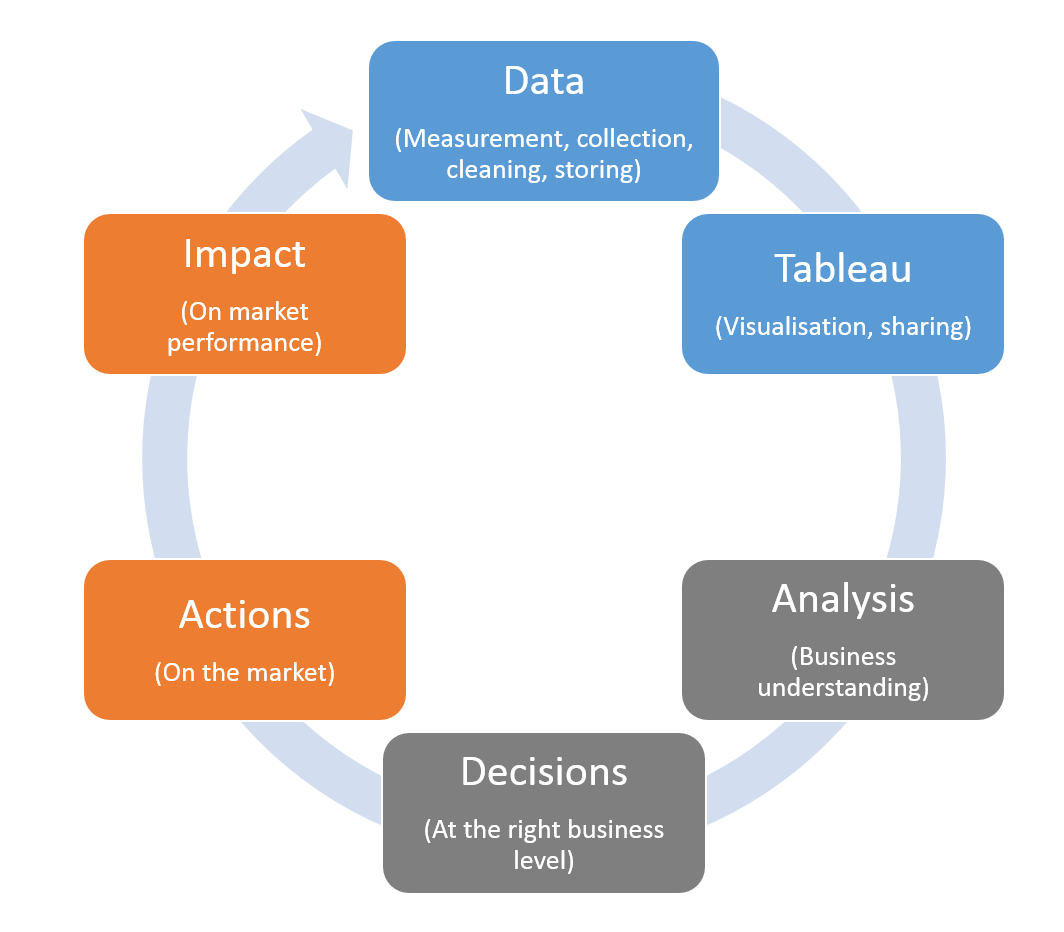 The ultimate success depends on the corporate analytical skills, decision making speed and ability to execute actions on the market (by market I mean the environment of the organisation, in which it operates). Then all this reflects in the (performance) data collected and the cycle begins again. If the corporate performance has not improved, there may be an issue at various stages:- having non-insightful information sources (the data collected or the visualisations) or the lack of deriving business insights- lack of timely business decisions- inability to transform the business decisions to actions (or being late with the action)- inability to execute the action in the business environment.
Self-service BI and Tableau
Tableau is all about self-service BI and in their white paper they define it as 'The facilities within the BI environment that enable BI users to become more self-reliant and less dependent on the IT organization. These facilities focus on four main objectives: easier access to source data for reporting and analysis, easier and improved support for data analysis features, faster deployment options such as appliances and cloud computing, and simpler, customizable, and collaborative end-user interfaces.'With generalisation and simplification the corporate success of a self-service BI project depends on:- providing clean, fresh (=regularly updated as new data is generated), reliable (= the source and data collection method itself is authentic, validated, approved by consensus) data,- visualised in an insightful way (= pointing out the right associations, the right level of detail with the flexibility to drill-down or up in the data for exploration, etc.),- and finally, shared effortlessly with the right audience (e.g. distribution via Tableau Server & this also means that data discovery in the dashboards is self-explanatory, straightforward).We have arrived to the point of this post. The fourth element of a really successful self-service BI project is overlooked. That one has very little to do with IT, data visualisation or having the right infrastructure to share reports. The fourth element is...Corporate analytical and decision making skills
While Tableau is excellent in 'democratising' data, shining light on data structure and inaccuracies and being a rapid fire tool in data discovery, users still have to know what they are looking for. They need to understand the business terms (in the data set), be able to make associations between items, connect pieces of information and translate the visual insights into business decisions that lead to actions. You may think I am playing 'bullshit bingo' by throwing these generic terms at you. Far from that, I cannot stress enough the importance of corporate analytical and decision making skills. Nothing is worse then seeing great dashboards fall into oblivion because users are unable to translate the visual insights (this is how I call the right data content presented in the right way) into business insights.Let's say a dashboard shows the Pareto-chart of annual sales revenue by client with the drill-down opportunity to check client history, complaints, number of transactions, etc. It is a gold mine of business insights (are we exposed to a few large clients and our portfolio is over concentrated, are complaints a barrier for smaller clients to have more/larger transactions with our company, etc.). If the business user is unable to decipher this information from the dashboard and associate it to other available sources, the dashboard did not reach its aim. Even if it was not the fault of the dashboard. Sometimes decision making is easy - like if it is red, intervene - but often not.What and how to analyse?
Let me bring a simple list of questions to demonstrate the thinking process in business analysis. In this case the viewer of the Tableau dashboard is working at a manufacturing company, possible observing sales / market share performance across the product portfolio in various geographies. The dashboard can help the most if this person already has similar questions in mind:- What is 'good' performance, what is 'bad' performance (where are the limits and where is the point to intervene - e.g. change the pricing of a brand or increase its availability)?- How are the various KPIs, measures related? Is there a system behind them? What drives performance? (A competitor brand gained market share, did they change pricing or invested more in advertising?)- In general what has big impact, what has small impact? What can be changed (in control), what cannot be changed (out of control)? (We have a brand that is constantly decreasing in market share but it is already at the end of its life cycle with an outdated image, no point to rejuvenate it, rather focus on accelerating growth elsewhere in the portfolio.)We could easily continue the list. These are all business questions that can be answered right at the spot looking at the data, if they are asked at all...Build dashboards to facilitate business analysis
By now we can agree that developing the analytical skills in business are crucial for the impact of self-service BI projects. Then how can we support the non-technical end-user better to arrive to business insights? Here is an incomplete list of ideas when building Tableau dashboards.- indicate how performance compares to a benchmark / target / budget with colours (e.g. good is 'green', bad is 'red', within tolerance or acceptable is 'orange'). Tell both the absolute and the relative (%) difference.- include definitions of the terms in the dashboard in the tooltips (a business user may know that phenomenon under a different name, not like it is called in the database). In general: be informative.- give information on data recency and source (what if market share is measured by two possible methods and users can confuse the two if it is not told). This may be the small text at the corner of the dashboard ('Data last refreshed on ...') or included on a separate 'Help' page.- design an effective analytical journey in the dashboard. This task often precedes even opening Tableau.- have call to action triggers if necessary (e.g. 'Select a Product to narrow down the analysis', 'Click on a Country to update all charts', 'Use the zoom controls on the top left to navigate on the map')- lead the user around the dashboard (e.g. add ordered titles to quick filters and parameters: '1. Select a Category', '2. Select a Product', '3. Select a KPI')- involve business stakeholders with no IT knowledge in the testing phase and discuss how they use the report, do they find what they are looking for, etc.- it may even be worth organising user trainings where user groups walk through the dashboard with the help of a 'champion' end userBack to the self-service BI project
Now we can conclude that the full process at a very high level looks like this:The ultimate success depends on the corporate analytical skills, decision making speed and ability to execute actions on the market (by market I mean the environment of the organisation, in which it operates). Then all this reflects in the (performance) data collected and the cycle begins again. If the corporate performance has not improved, there may be an issue at various stages:- having non-insightful information sources (the data collected or the visualisations) or the lack of deriving business insights- lack of timely business decisions- inability to transform the business decisions to actions (or being late with the action)- inability to execute the action in the business environment.