

It was a week of firsts:
- My first trip to Yosemite National Park with an incredibly keen Andy Kriebel leading us up to what at times felt like certain death.
- My first time in Denny’s, an establishment so generous in portion size no other meal has since hit the spot.
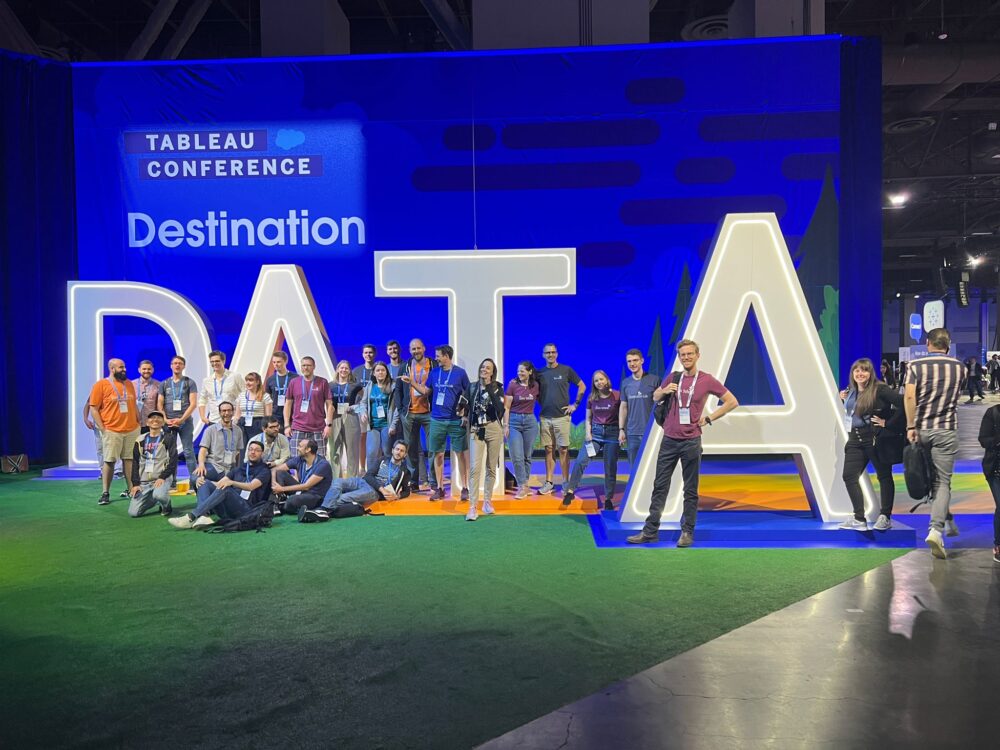
- And a first time experiencing a Tableau Conference.
All I can say is I’m counting the seconds until the next one. I wasn’t too sure what to expect going in. Of course I expected lots of Tableau and lots of passionate people talking about Tableau and how it has shaped countless careers and industries, but the sheer scale, energy and passion of the event took me by surprise. It also made Las Vegas the perfect place to hold such a festival. This was my first time visiting Las Vegas and I don’t think it will be my last!
I expected to have fun, I expected to learn a lot, but I didn’t expect to feel so inspired by the whole thing.
It was obvious that one of Tableau’s key strengths is the community that has built up over the years. When I asked people what their favourite thing about the conference was, the most common answer by a long way was the opportunity to re-connect with people…in real life! The conference is a wonderful vehicle for Tableau to showcase the road-map for the future and celebrate the wonderful successes over the years. For me, the true success is the chance to celebrate and nurture the community that underpins them.
My Favourite Sessions
Tableau conference consists of a huge number of sessions. Some are hands-on, others are panel discussions and some are lecture-style talks. Throughout the week I tried to mix up the type of sessions as much as I could. It would take too long to list every session and the impact it had on me, so here are a few of my favourites.
To start, I cannot overlook the keynote. This was my first taste of Tableau Conference and I was blown away by the sheer energy of the crowd. ‘I am definitely in America’ mused Hannah Fry whilst she judged the Iron Viz competition a couple days later; this was a quote that certainly rang true for most of the conference.
Mark Nelson, Tableau CEO, started the proceedings. Mark discussed the incredible journey Tableau has taken to this point, and also how far we still have to go. ‘83% of CEOs want to be data driven, but 30% believe they are’. This encapsulates the potential for Tableau and the industry as a whole to keep reaching new heights.
Mark went on to discuss specific customer stories, with JetBlue utilising the newly coined Tableau Cloud to reduce time to insight. The fuel consumption dashboard they have developed has allowed savings on cost and also helped reduce the impact on the environment.
Standard Chartered discussed their incredible scale in Tableau adoption. In just four years they have gone from 100 Tableau users to 10,000.
The last customer story was the one that struck a chord the most for me. Katie Fitzgerald, from Feeding America, discussed how leveraging Tableau had allowed the company to go from using a survey every four years to creating a dashboard that used real time data to find those short of food. She stated that there ‘isn’t a food scarcity issue, there is a food access problem’; data has allowed them to address this concern.
Beyond the keynotes my stand-out technical sessions were Cool Stuff with Tableau with the Flerlage twins. This was an incredibly informative, yet hilarious session in which we were shown some really cool tricks using Tableau. They showed us a nice way to work with histograms and awesome use cases for (underrated!) set controls. I found the table calculations example most useful. Kevin compared table calcs with LODs and really emphasised how unchecking a dimension in the table calc configuration window is comparable to a FIXED on the same dimension. This was a little bit of a eureka moment and I have already been putting this new found knowledge into practice.
The last session to mention, and the last of the conference, was Speed Tipping with our very own Lorna Brown and Ann Jackson. As the name suggests this was a high-octane session in which the two traded the floor to show a host of tips within Tableau. Ann showed us some awesome parameterised control charts, drill-downs using sets and parameters, and a really great use of sets to select a dimension and see where it ranks in a long list. During her time, Lorna showed us some great spatial calculations and broke down how to create small multiples live on stage. This is the sort of thing I would brainlessly copy and paste out of a blog, so it was really insightful to see the logic behind it.
All of this content and I still haven’t mentioned Iron Viz! That was without doubt some of the most impressive Tableau skills I have ever seen. The composure of the three contestants amid a feverish atmosphere was remarkable. To build three completely different takes on the same dataset and come out with such incredible insights and visualisations really underlined why they were up on stage. A huge congratulations to Will Sutton on a simply mind-blowing performance. The story-telling, analysis and Tableau skills on display made him a worthy champion.
It was one of the best weeks of my life
I must thank The Information Lab (TIL) who made the experience possible in the first place and the individuals I shared the experience with who made it so special. The energy and positivity I encountered from every TIL member, conference attendee and host was infectious…together you got me through a rather chronic case of sleep deprivation.
It was a week of realisations
I realised the sheer breadth of industries that rely on the power of data to drive them forward and, more than that, the sheer number of lives touched in the process. It is easy in day-to-day consulting to lose touch of what lies behind the numbers. This week has reminded me to always consider the bigger picture and inspired me to use my experience in analytics to effect positive change to peoples’ lives.
I also realised how lucky I am to be part of The Information Lab!
The regular broadcast about Tableau Visionaries and Ambassadors around the conference centre was a ‘who’s who’ of TIL consultants around the world, most of which have come through our Data School programme. I had countless conversations with people who had heard of the company through sessions and conversations they’d had at the conference. Many also knew about us through googling content such as blog posts or YouTube tutorials. This is testament to the outstanding networking my colleagues undertake and the World-renowned reputation everyone at the company has worked tirelessly to build over the years.