

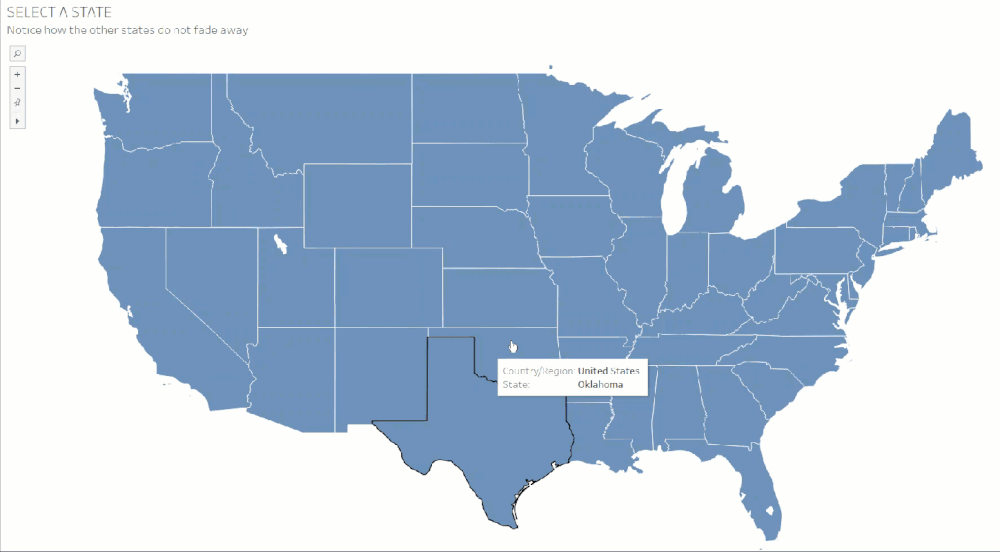
Ever clicked on a mark on a Tableau worksheet or dashboard and notice the other (unselected) marks would fade out? Well, I personally am not a fan of this default feature because I would still like the other marks to be visible. You can see the fade out that I am referring to in Fig. 1 below.
I was recently directly to Brian Moore's blog on how to counter this issue. I will be detailing the steps below to consolidate my learning, and hopefully this may help someone else as well.
There are three methods you can use to achieve this with Tableau's worksheet and dashboard actions. The actions being: highlight, set, and parameter actions. I will be using Tableau's Sample Superstore data.
Highlight Action
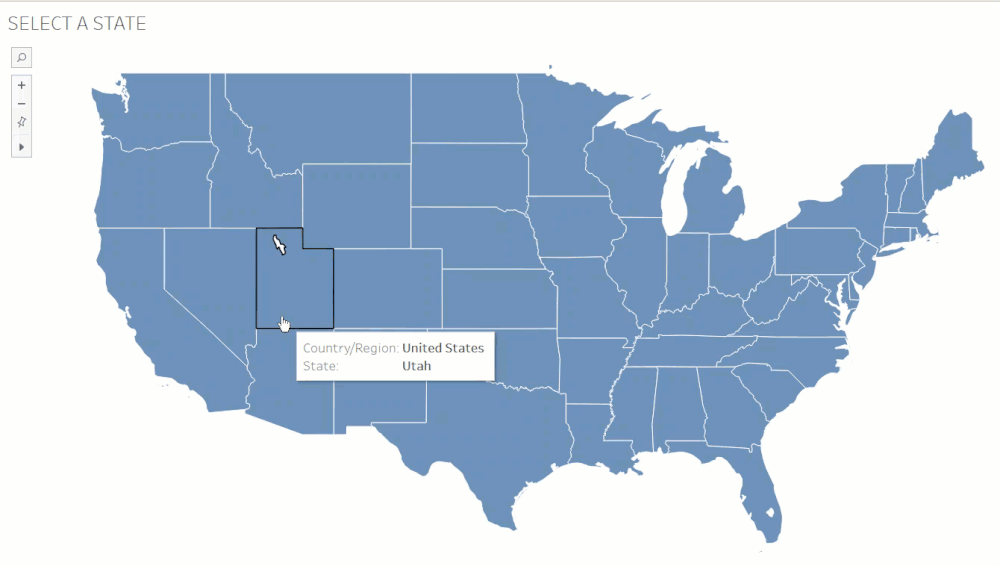
1. Produce a map of the US states on a worksheet. My worksheet is named Select a State, you can name yours as you wish.
2. Create a calculated field and type in the following in Fig. 2 below. Normally, I would put a blank entry by writing '' but for this example it would help to write NULL Highlight. To iterate, you can write any text you wish.
3. Add the NULL Highlight calculated field onto the Detail card in the Marks pane on the worksheet.
4. Make a highlight action with configurations as seen in Fig. 3 below.
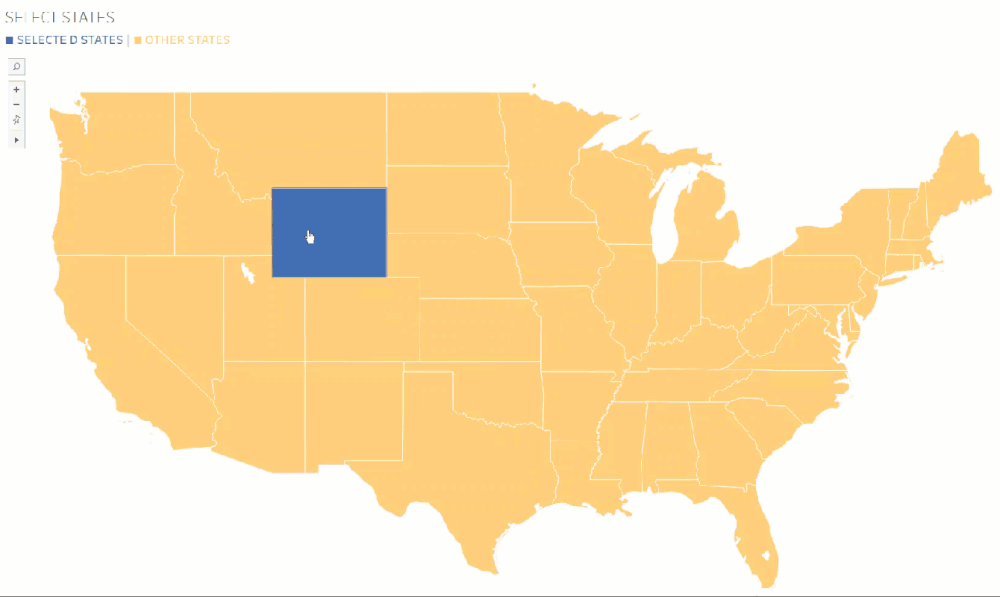
Click on a mark in the map and you can see how the other states do not fade out as seen in Fig. 4 below.
Why does this work?
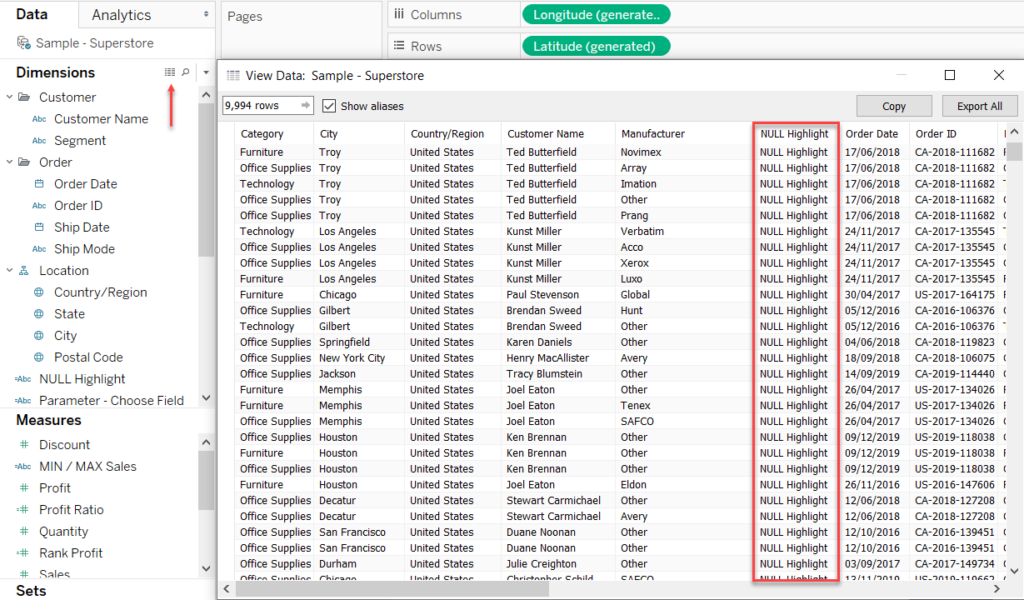
The NULL Highlight calculated field that we produced in step 2 appends that text to each row in the data. You can see how this looks in the data if you click on View Data in the worksheet as seen in Fig. 5 below.
What Tableau is doing with this Highlight action, is highlighting every mark in the view. This is because NULL Highlight is attached to every row. This essentially disables the default fade out that we usually see in Fig. 1.
The issue with this is that its not entirely obvious what you have selected. Sure, you can see that the selected mark is slightly darker than the other marks. Or, it has a black outline. However, these finer details are not too obvious for most end users. We can resolve this by using set actions or parameters actions.
Set Action
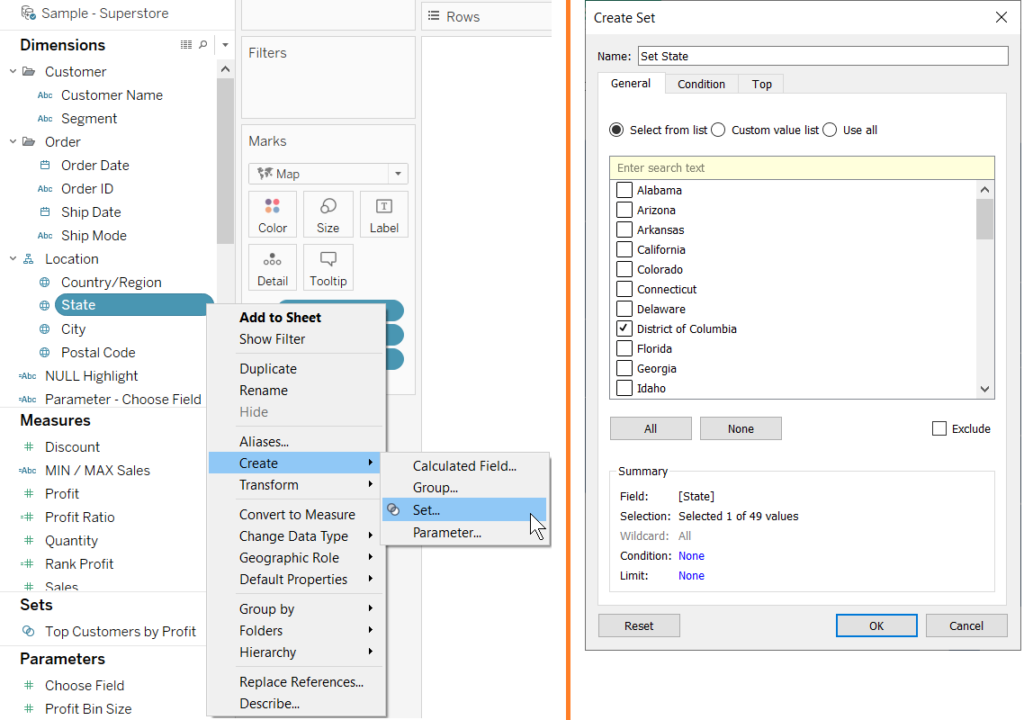
1. Create a set from the State field. I named the set to Set State.
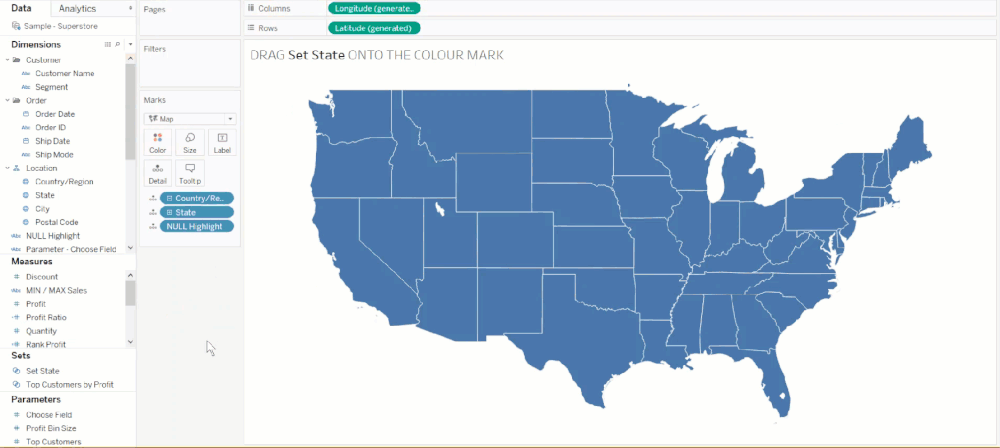
2. Drag Set State onto the Color card in the Mark pane.
3. Produce a set action with the configurations in Fig. 8 below. Note that the NULL Highlight action is still in effect on this worksheet.
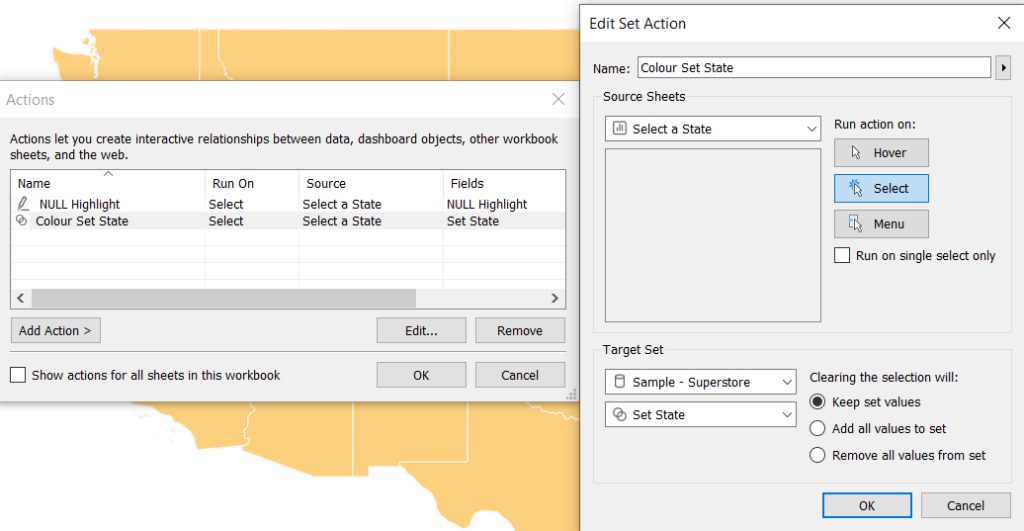
You should be able to click on any state, or states, on the map without the other states fading out, and be able to distinguish which state you selected since you have put the set on the Colour card.
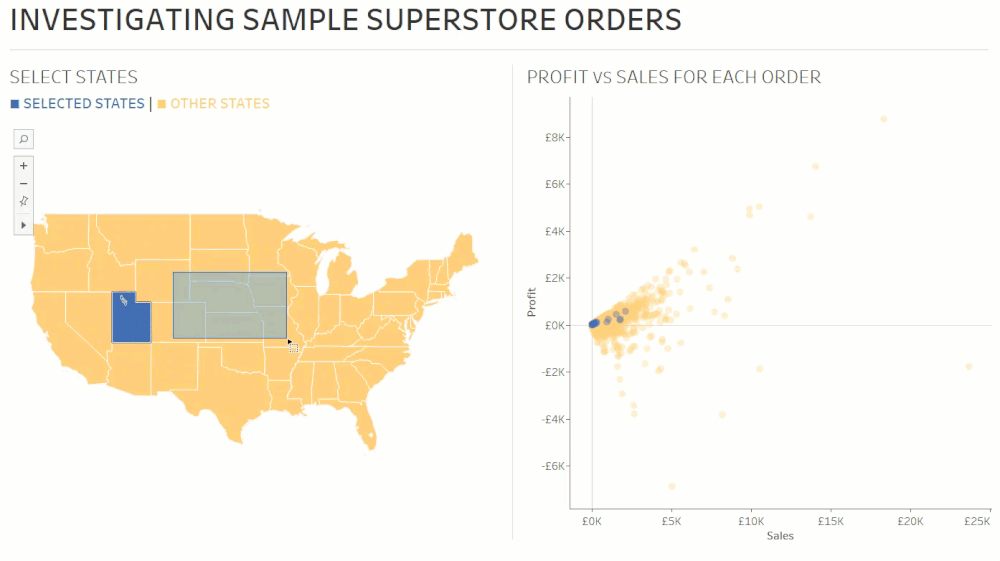
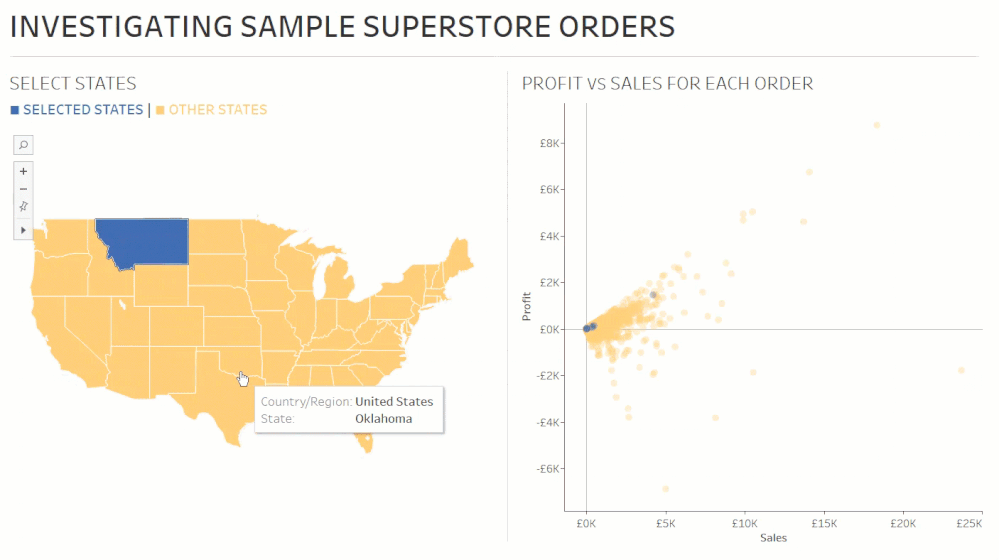
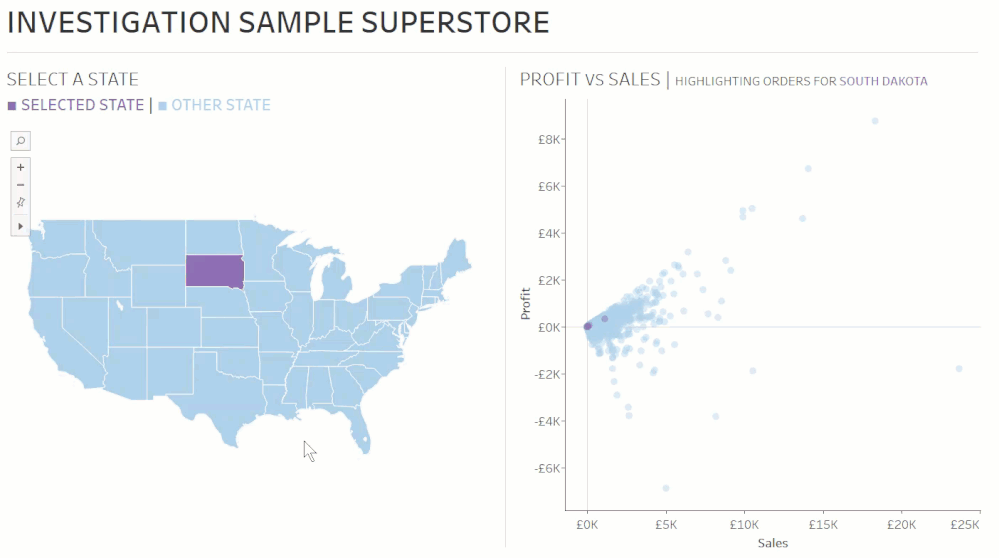
You can take this further. I have made a dashboard where I have the map above and a scatter plot between Profit and Sales with Order ID on detail.
I have also put a table that pops up if the user would like to break down the view to look at the orders for the states they selected.
Parameter Action
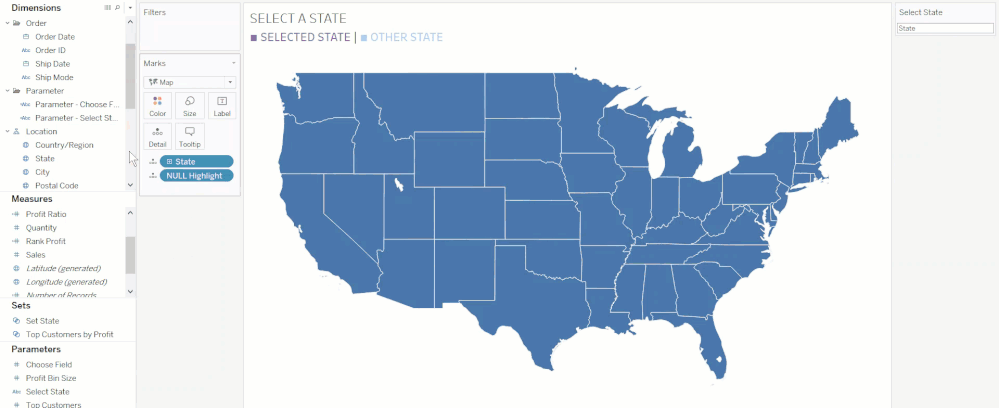
1. Produce a map of the US states on a new worksheet. Drag the NULL Highlight field onto Detail. Add the Highlight action for this new worksheet.
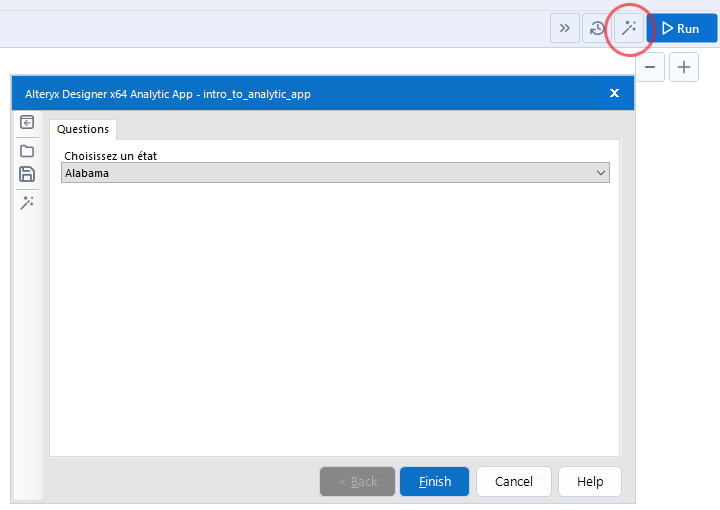
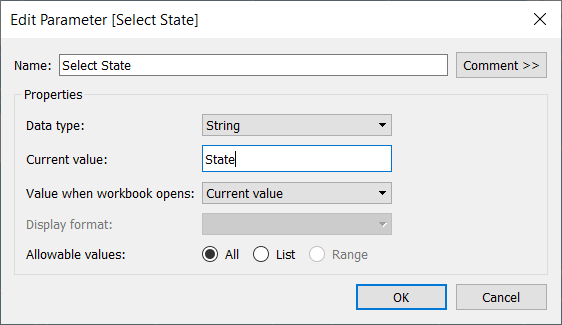
2. Create a parameter as seen in Fig. 11 below. The data type should be string and I have named it Select State. You can name the parameter to what is convenient to you. I have put in State in the Current Value section. You can put anything in there.
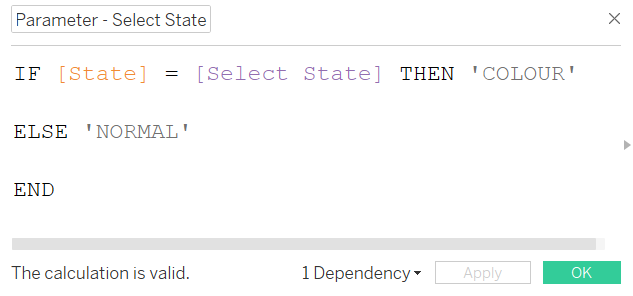
3. Create a calculated field using the parameter created above.
IF [State] = [Select State] THEN 'COLOUR'
ELSE 'NORMAL'
END
4. Drag the new calculated field [Parameter - Select State] onto the Colour card in the Marks pane.
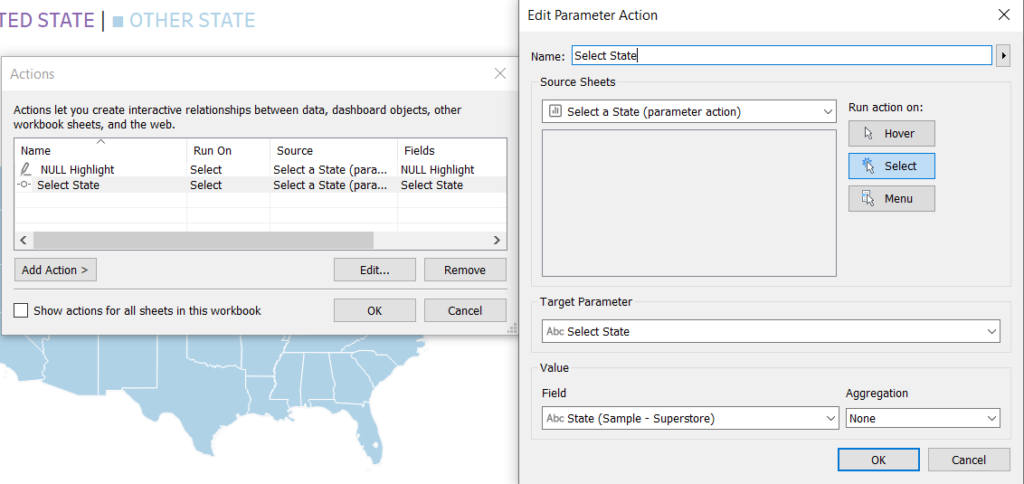
5. Produce a parameter action in the worksheet with the configurations as seen in Fig. 13 below.
Note how the NULL Highlight action is set up for that worksheet as well.
After configuring the parameter action, you can click on any state on the map and the selected state will be coloured differently to the other states that were not selected. Since the NULL Highlight action was also configured for that worksheet, the other states do not fade out.
Since it is a parameter action, this can only work by clicking on one mark at a time. You cannot select multiple marks like you do with sets. Also, we could achieve the same thing in this parameter action example with a set action as well - where we only want one selected mark at a time.
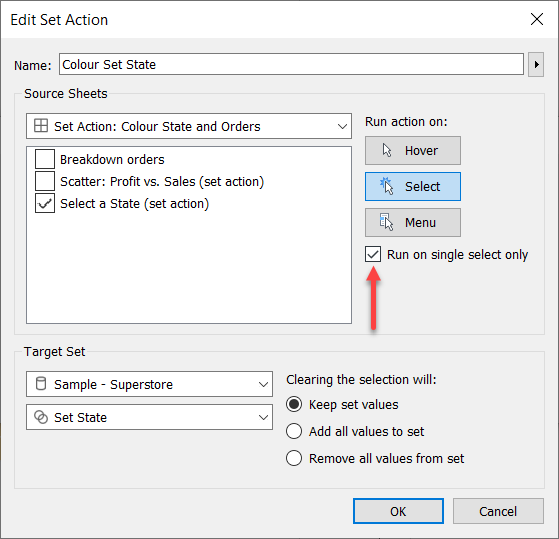
This can be done by revisiting the set action configuration in Fig. 8 above. You need to check the Run on single select only option. This makes sure that Tableau will only allow the user to click on one mark and have it coloured. If the user chooses multiple marks then nothing will happen.
Similar to Fig. 10 above, here is a dashboard that achieves the same thing when clicking on a state to colour the orders in the scatter plot adjacent to the map.
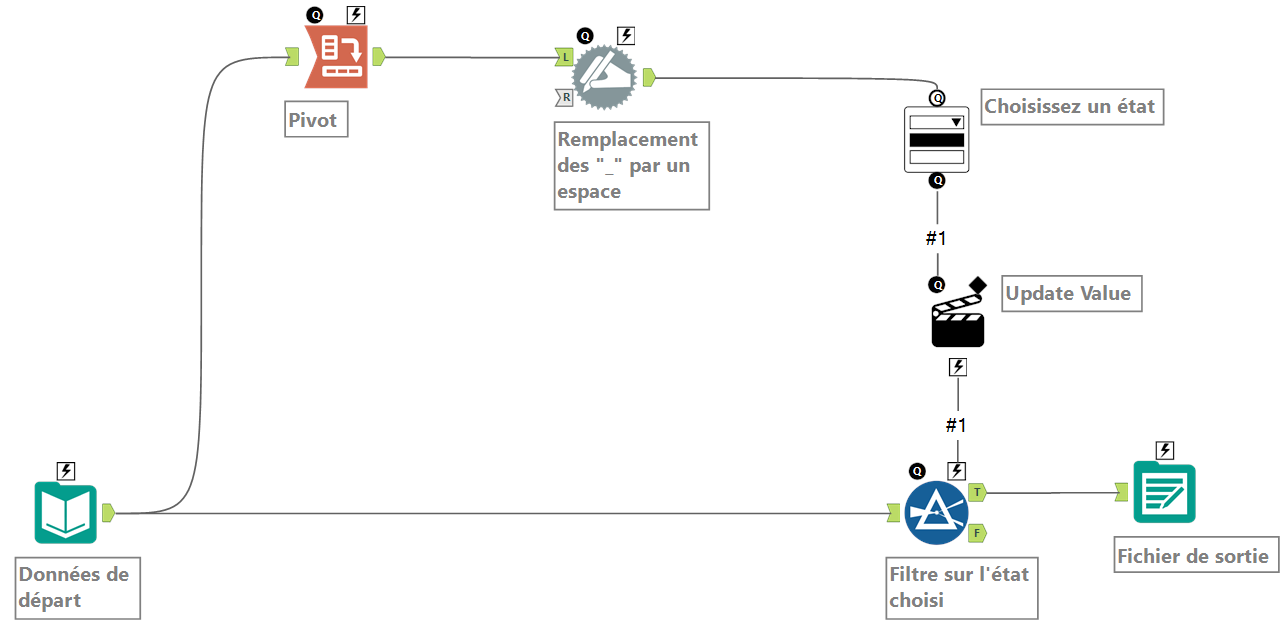
I have made downloadable workbooks for the set action and parameter action examples if you would like to see how it was done.
I hope you have found this blog useful. Thank you, Brian Moore, for your blog because I certainly found these tips useful when building dashboards for clients.
Please let me know if you have any questions in the comment section below.