

Tableau 2022.1 is here! We’re always excited to see how each releases helps people make data-driven decisions faster and easier. You can see a full list of 2022.1’s new features on Tableau’s product page. In this post we’re going to focus on the three features we’re most excited about and show how they can help you analyse and scale your data more efficiently.
TL;DR
The three 2022.1 features we’re most excited about are:
- The Workbook Optimiser is a best practice check that will improve overall dashboard usability. We also love how the Workbook Optimiser interface encourages authors to use these best practice habits when they build normally.
- Customise View Data is a small, but really nice, feature improvement. It lets you customise how you present the tabular data behind a visualisation—and all those customisations stay when you download the underlying data. This is great for both screen readers and any users who needs to download the underlying data.
- New Accelerators on the Tableau Exchange is becoming more like an app store with new Tableau Accelerators. Accelerators are template dashboards that help you start visualising your data without having to build a standard dashboard from scratch. While there is still a lot of room for improvement with Accelerators, we’re looking forward to seeing where this goes.
Honourable Mentions:
- Swap Root Table is sanity-saving feature for any author who has ever built their data model incorrectly. Now, instead of starting again from scratch, you can swap your fields around with all relationships kept in context.
- View Acceleration lets your server administrator speed up a dashboard with one click. However, there’s little information out yet about how it does this.
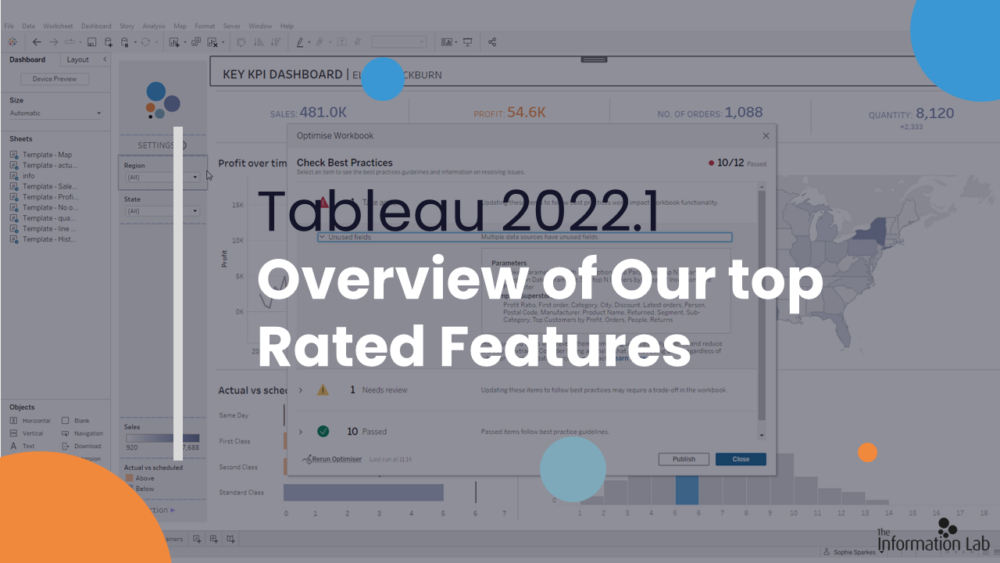
Workbook Optimiser
While the Workbook Optimiser won’t automatically optimise your workbooks for you, it will highlight elements on your dashboard that aren’t based on best practice. This means that you don’t have to be an expert to know how to optimise a workbook— which is especially helpful for authors who mightn’t have had formal Tableau training.
The Workbook Optimiser currently checks against twelve design elements (like number of data sources, unused fields, and number of LODs). But Tableau have already said that they’ll be adding more checks in the future. We’d really like to see checks against accessibility added to it in the future.
The Workbook Optimiser’s self-service interface uses a traffic light warning system (Take action, Needs review, Passed) to show how your workbook performs against each of the twelve checks. When you expand a check, you see:
- What the actual check is (for example ‘unused fields)
- The specifics of the issue (if its traffic light rating is ‘Take action’ or ‘Needs review’)
- Details about the best practice guideline
- A link to learn more about the guideline (Note at the time of publishing this link wasn’t working)
The interface layout is very clear. We’re sure it’ll help authors use these best practice habits when they build normally.
The Workbook Optimiser lives under the Server menu. You can also choose to run it as one of the options in publish interface when you publish a Dashboard to Server or Tableau Online. A nice touch is that the Workbook Optimiser remembers the last score for your workbook. If you update the workbook, and then re-run the optimiser, you can see how much your workbook has improved.
Customise View Data
We think you’ll love Customise View Data. It is one of those small feature improvements that really adds to the user experience. This feature was one of the most requested features in the Tableau Forums and we are happy to see how beautifully Tableau has implemented it on desktop and Tableau Server/Tableau Online.
Customise View Data lets you customise how you view the tabular data behind the visualisation. And this customised view stays when you download the data as a CSV. This optimises the data table for both screen readers and any users who needs to download the underlying data.
Specifically, you can:
- Choose what columns to show
- Change the order of columns
- Sort the columns
- Show Aliases
- Export multiple tables
- See a Summary view (and if you’ve built your data using the data model, you’ll also the individual tables in the underlying data model).
We hope to see more features added to the View Data interface in the future.
New Accelerators on Tableau Exchange
By adding new Accelerators, the Tableau Exchange is starting to feel more like an app store—and we we’ll see even more features added to the Tableau Exchange. We are excited to see how the Tableau Exchange grows!
Accelerators are template dashboards that help you start without having to build a standard dashboard from scratch. Currently there aren’t many accelerators available, and the ones that are available aren’t as beautiful or clean as similar dashboards on Tableau Public. However, we expect to see new Accelerators from trusted Tableau sources added soon.
One of the major drawbacks we see with Accelerators is that it’s highly unlikely that your data will perfectly fit into an Accelerator dashboard. This means you will still have to have data-experts on hand to modify the Accelerator dashboard to fit your exact data model.
Honourable Mentions
Swap Root Table
If you’re an author, then this feature is for you. Before 2022.1 if you realised you’d built the data model incorrectly your only option was to start building it from scratch. With Swap Root Table you can swap and choose which table becomes your root table with a single click. And since Swap Root Table keeps all your relationships in context, you’ll have a working data model when you finish swapping.
This is a small user experience improvement, but it will help all dashboard creators managing multiple tables in their data models.
View Acceleration
According to Tableau, this new feature has immense potential 'Making workbooks up to 100x faster with the push of a button'. But we think this sounds too good to be true (at least in right now).
View Acceleration lets a server administrator speed up load time with a single click. And from our experiments we did see improved load times using View Acceleration (although no way near 100x faster). However, it’s unclear what happens in the background to achieve this acceleration. And since we don’t know how the View Acceleration works, we don’t know when too much acceleration might slow things down across the server.
Looking for more information?
Check out the Information Lab’s Tableau Tim in-depth videos on 2022.1 new features
See all the new Tableau 2022.1 features on Tableau’s feature page