1 March 2017
You can download Tableau 10.2 hereThe new version of Tableau, version 10.2, contains various new features that are worth blogging about. One of the new additions to the software is the Legend Per Measure feature. I’ve participated extensively in the beta of the latest release and while I was doing that I created a video in which I demonstrated how easy it is to apply a legend per measure. I’ve added the video in case you missed it. The next step is to control (or for macOS cmd) drag your green field called ‘Measure Values’ to the ‘Color’ mark on the Marks Card. Then change the dropdown from text to square in case you want to colour the background of each cell. You’ll see that Tableau just creates one colour legend for your whole table. This has always been the default behaviour, so nothing new here. However, and this is actually the new bit, right click on the Measure Values field that is on Color and click ‘Use Separate Legends’.
 There you go! Now you can adjust the colour for each of the measures in the view. This means you can control which of the columns should contain colour. If you for example want a column to be completely white you can set this up by changing the colour palette type to ‘Custom Diverging’. This gives you the option to select a range of colours. This means you can set both the left and right colour to white, don’t forget to change the ‘Step Size’ to 2.
 Hopefully this will be help you to get started with Tableau 10.2 and if you have any questions please comment below or ask me on Twitter.
[embed]https://www.youtube.com/watch?v=MRPK2WI1vgs[/embed]
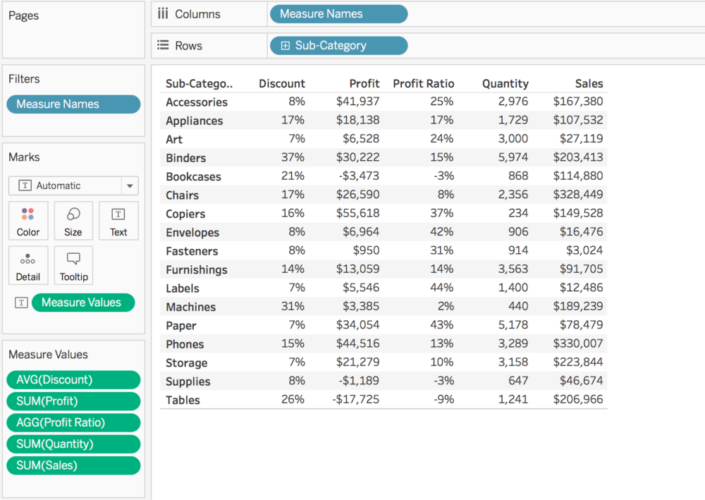
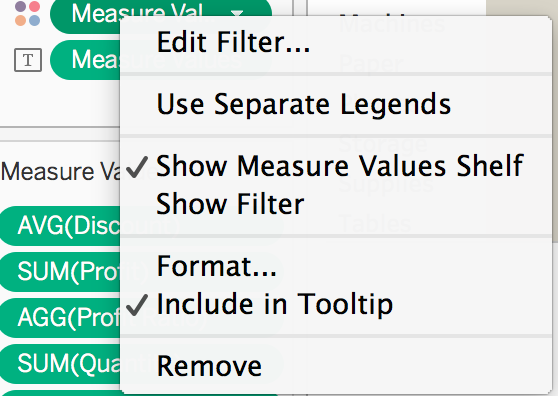
What this new feature entails is that you can now create unique legends for each of the measures you have in your view. From my experience as a consultant I come across this requirement very frequently when I’m at customers. For example, finance departments that deploy Tableau would certainly benefit from this new feature because this makes it easier to colour Profit & Loss tables.But now you’re probably asking, how do I set this up? Well, let’s use Tableau’s default Superstore dataset. The first step is to build a Measure Values and Measure Names table. For example this one that show Sales, Profit, Discount, Quantity and Profit Ratio per Sub-Category: The next step is to control (or for macOS cmd) drag your green field called ‘Measure Values’ to the ‘Color’ mark on the Marks Card. Then change the dropdown from text to square in case you want to colour the background of each cell. You’ll see that Tableau just creates one colour legend for your whole table. This has always been the default behaviour, so nothing new here. However, and this is actually the new bit, right click on the Measure Values field that is on Color and click ‘Use Separate Legends’.
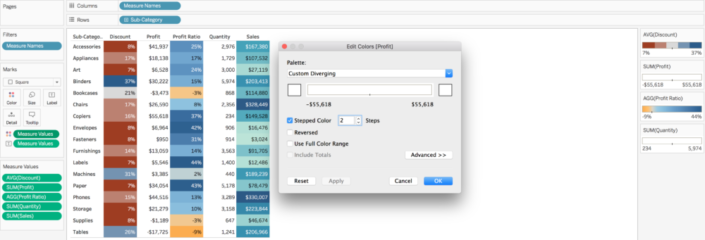
 There you go! Now you can adjust the colour for each of the measures in the view. This means you can control which of the columns should contain colour. If you for example want a column to be completely white you can set this up by changing the colour palette type to ‘Custom Diverging’. This gives you the option to select a range of colours. This means you can set both the left and right colour to white, don’t forget to change the ‘Step Size’ to 2.
 Hopefully this will be help you to get started with Tableau 10.2 and if you have any questions please comment below or ask me on Twitter.