

25 November 2013
Tableau does a great job at making it easy for users to work with their data, but understanding data and data structures will make a big difference to what you can produce. A database, as defined by wikipedia, is an 'organised collection of data'. Databases are usually connected to input tools for adding and changing data (these could be a software front-end, or a website, or just a form in the database), and to query tools like Tableau to get data back out, often filtering or manipulating.There are many different types of database, some with rigid two-dimensional structures (tables), some with parent-node structures (trees), and others with very little structure. The most common databases store data in tables, and if you’re a user of Excel or Access you’ll be familiar with this. A table is a two dimensional grid of data, where a particular data field is stored in a column, and a collection of fields or a record is stored on a row. We’ll focus on table-based databases here. We also won’t worry about collecting data, as Tableau is about output, not input.Tableau’s Superstore sample database is an excellent example of what works best for Tableau. Have you ever opened it (it’s in DocumentsMy Tableau RepositoryDatasources)? Every column has a unique dimension or measure, and for every combination of data there is a different row.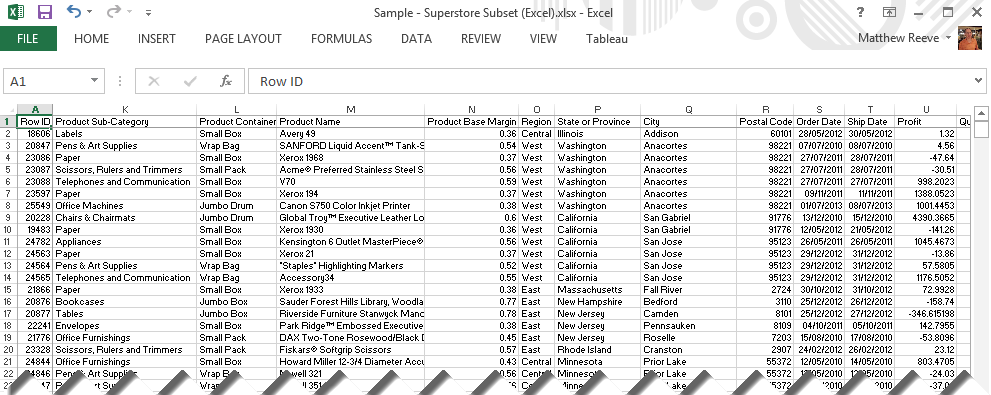 If we load this into Tableau, we can use our dimensions to group our output into unique combinations, and all measures in our data which have a particular combination will become aggregated (typically a sum or average). In the example to the right, I have Sum of Sales for each Product Sub-Category, for each region. If I want to see the total across all four regions, we just take the Region dimension off Columns.
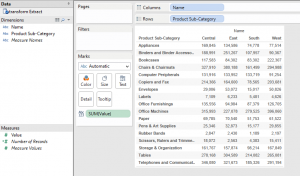
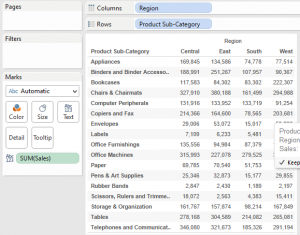 But, you might ask, what is wrong with having a different column for each region? The data is still in a table, and you can see all of the values I want in my output. Well, if you copy this table and load it as a datasource, you will have four measures (as below), which are all Sum of Sales. To show them all in the same table, you need to use Measure Values, which is a really powerful tool in Tableau and not one you should have to use just to show a basic total. If you want to show the sum of all four, you need a calculated field. What if you want to filter? Well, essentially you would have to have a calculated field for each combination.
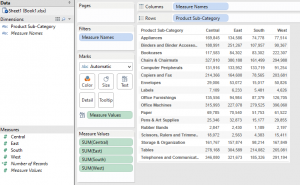 Changing your structureSo what if you’re not happy with the structure of your data. How can you change it? Well, there are some easy options.Tableau Reshaping ToolIf you use a lot of Excel datasets, you should have the Tableau Excel Add-in installed. There is a Tableau Knowledge Base article which explains more about how to use the Excel tool to reshape data.
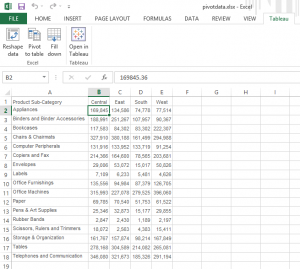 AlteryxThe Information Lab became Alteryx partners recently, so we’ve been learning a lot about it. It shares characteristics with Tableau: It’s visual, it’s easy to use, and it’s very powerful. If you have Alteryx, there is a simple workflow you can use to transform your data, without needing to install the Excel add-in. You need an Input for the file in the wrong format, a Transpose with (in this case) the Product Sub-Category as the key field (a key being a dimension in this case) and the four regions selected as values (measures), followed by an Output to save this back to a file, maybe a Tableau TDE!
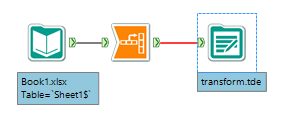
 SummaryThere are many ways you can display your data by moving rows and columns around in Tableau. But the key point is to remember that in your data table, everything should go down. Even if you want the output to go across your report, each column should be a value on a separate row in a column. You might think you'll end up with a long and thin table, which doesn't print very well. That's what output tools are designed to correct. Let them do it, and keep your data in a simple structure.
If we load this into Tableau, we can use our dimensions to group our output into unique combinations, and all measures in our data which have a particular combination will become aggregated (typically a sum or average). In the example to the right, I have Sum of Sales for each Product Sub-Category, for each region. If I want to see the total across all four regions, we just take the Region dimension off Columns. But, you might ask, what is wrong with having a different column for each region? The data is still in a table, and you can see all of the values I want in my output. Well, if you copy this table and load it as a datasource, you will have four measures (as below), which are all Sum of Sales. To show them all in the same table, you need to use Measure Values, which is a really powerful tool in Tableau and not one you should have to use just to show a basic total. If you want to show the sum of all four, you need a calculated field. What if you want to filter? Well, essentially you would have to have a calculated field for each combination.
 Changing your structureSo what if you’re not happy with the structure of your data. How can you change it? Well, there are some easy options.Tableau Reshaping ToolIf you use a lot of Excel datasets, you should have the Tableau Excel Add-in installed. There is a Tableau Knowledge Base article which explains more about how to use the Excel tool to reshape data.
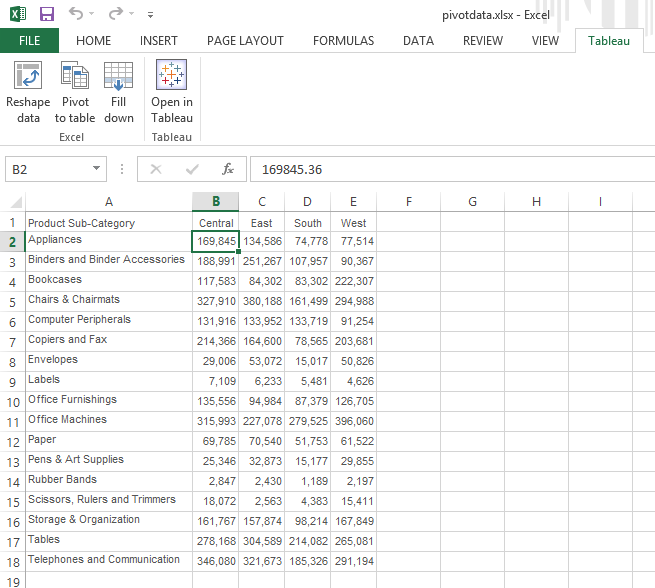 AlteryxThe Information Lab became Alteryx partners recently, so we’ve been learning a lot about it. It shares characteristics with Tableau: It’s visual, it’s easy to use, and it’s very powerful. If you have Alteryx, there is a simple workflow you can use to transform your data, without needing to install the Excel add-in. You need an Input for the file in the wrong format, a Transpose with (in this case) the Product Sub-Category as the key field (a key being a dimension in this case) and the four regions selected as values (measures), followed by an Output to save this back to a file, maybe a Tableau TDE!
 SummaryThere are many ways you can display your data by moving rows and columns around in Tableau. But the key point is to remember that in your data table, everything should go down. Even if you want the output to go across your report, each column should be a value on a separate row in a column. You might think you'll end up with a long and thin table, which doesn't print very well. That's what output tools are designed to correct. Let them do it, and keep your data in a simple structure.