9 October 2017
You may have read my previous post on creating a stepped colour scheme with a colour alert for a continuous field, but then realized that you have a discrete field (and it breaks the view when you try and change it to continuous!) and wondered how to achieve the same result with a discrete (blue!) field.Rest assured, it turns out to be even easier to do with a discrete field, although the methodology is slightly different. I will cover two possible approaches here: using bins and using calculated fields.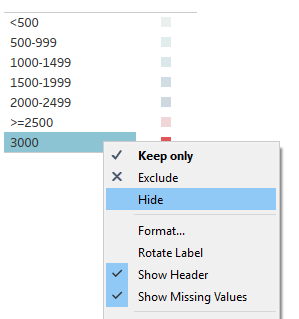 And use the legend for this worksheet in your dashboard instead of the legend that came with the original worksheet.
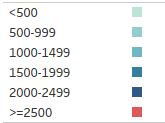
Bins
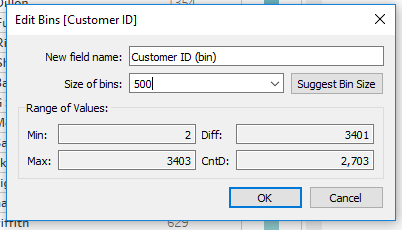
Note that it is only possible to create bins with numeric fields. So in this (possibly convoluted) use case, imagine that something has gone wrong with our customer database and we need to identify which customers are affected. We know that any customer IDs above 2000 almost certainly will have an error (say, the wrong shipping address). Below that, it is likely, but randomly distributed (and with decreasing probability every 500 values).- I right-click on my discrete field and select “create bins”.
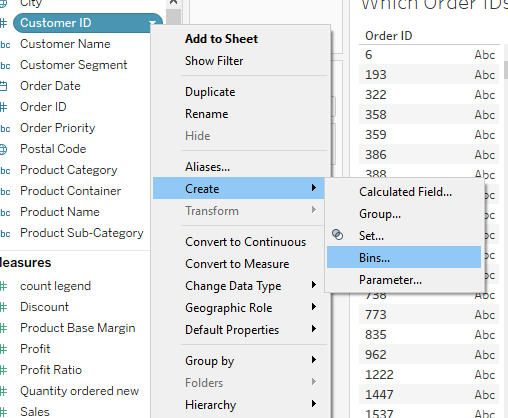
- I then choose a bin size of 500.
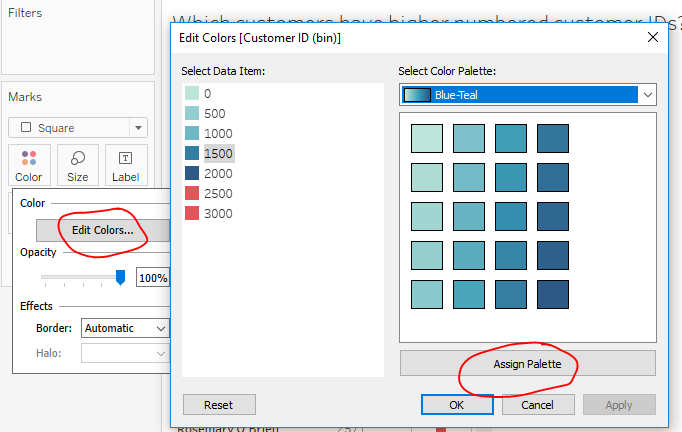
- I drag my newly created bin field [Customer ID (bin)] onto the colour shelf, get into the “Edit Colors…” menu, and choose a single diverging colour palette, e.g. Blue-Teal, and click “Assign Palette”. I can then customize the palette accordingly, including picking red for values of 2000 and above from other palettes.
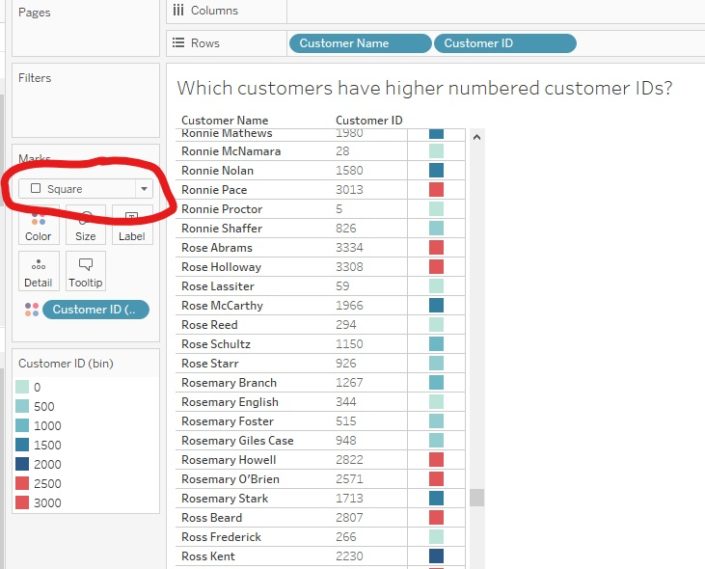
- Finally, I change the mark type to square and now I have a visual cue to help me spot the customer IDs most likely to have an error, and in need of immediate attention.
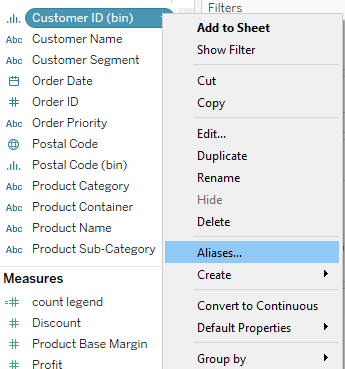
- Of course, you may want to change the legend labels to make things clearer. You can do this by right-clicking on your bin field [Customer ID (bin)] and then selecting “Aliases…” from the menu.
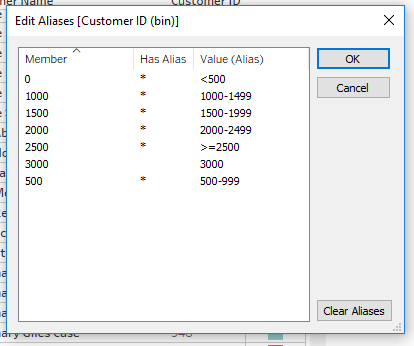
- From there, you may also wish to further tidy things up by removing that extra value of 3000 from the legend, since it has the same colour (i.e. it is already included in the preceding bin, >=2500). In that case, you can do something a bit tricky by making a fake legend. Create a new sheet with [Customer ID (bin)] on rows or columns (depending on whether you want a horizontal or vertical legend), and then put [Customer ID (bin)] on the colour shelf.
- Next, hide the values you wish to hide.
And use the legend for this worksheet in your dashboard instead of the legend that came with the original worksheet.Calculated Field
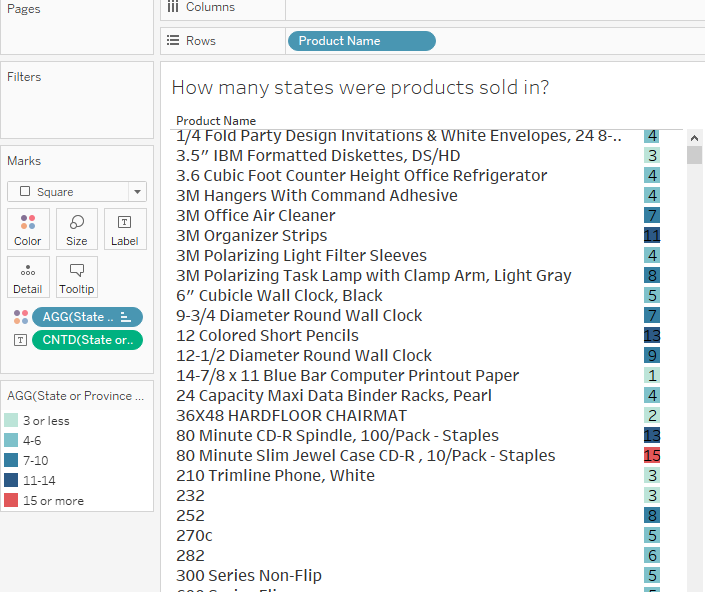
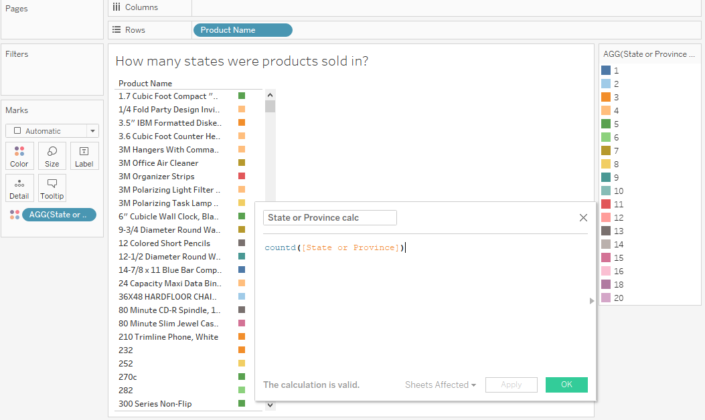
In this example, I want to know in how many states my products have been sold, with a darker colour for more states, but with a red alert if it has been sold in more than 15 states.- I create a simple calculated field showing COUNTD([State or Province]) and drag it onto my colour shelf (with my [Product Name] field in rows). This just makes a rainbow, and values for each value. I might want the steps to increment by 3, and turn red for any value over 15.
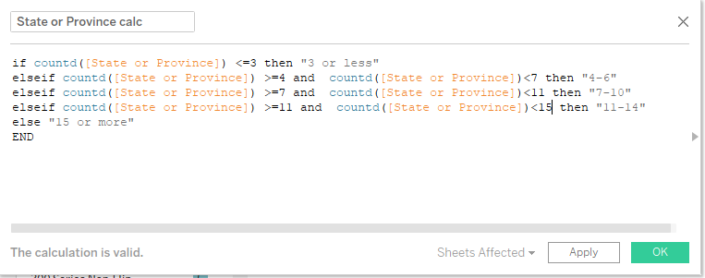
- So I edit my calculated field. This is essentially creating bins manually, but with more control over the value range and labels.
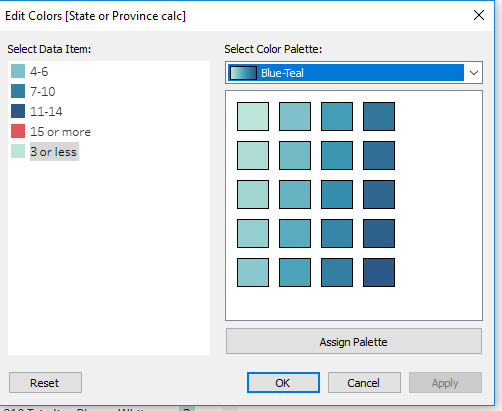
- I can then click into the colour shelf, get into the “Edit Colors…” menu, and choose a single diverging colour palette, e.g. Blue-Teal, and click “Assign Palette”. In this menu, I can then adapt the colours to my preferences (e.g. I know that I want value “11-14” to have the darkest colour for contrast, as I want “15 or more” to be red).
- Finally, to check that the colour scheme has worked (and for better clarity), I can put the [COUNTD(State or Province)] onto the label (centre the alignment to get it in the box), and turn the mark type to square.