

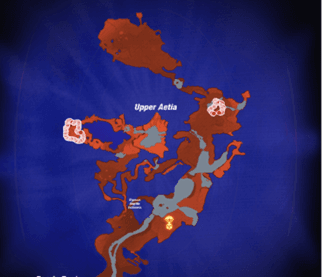
For this project I wanted to create custom shapes for the World regions and the regional maps. I could have tackled this in Alteryx which I am more familiar with however I heard that Snowflake can also do spatial. Here I will be discussing the benefits and limitations of spatial data in Snowflake.
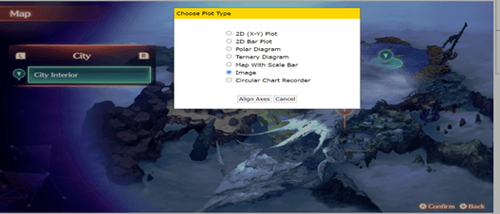
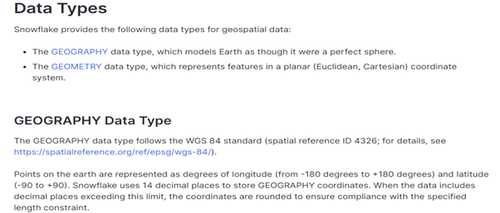
First of all, to create my custom shapes I used https://apps.automeris.io/wpd/ this allowed me to draw spatial points on an image. The dimensions of the spatial points were defined by the length and width of the image making these points outside the worlds geometry. For example the images used for the regions were 1280 by 720, I could then download all these points to a csv file. The big problem here is Snowflake can only map within the worlds geometry which is -180 to 180 as you can see 1280 by 720 is well outside this range. So all the points now had to be converted to the worlds geometry, luckily with some help from ChatGPT and some research there is a python package that can do this. First of all we should note there are spatial reference system identifiers (SRID) which allows you to change the distortion of a map. The geography function in snowflake is set to SRID 4326 whereas geometry function can use different SRID’s however you can’t switch between SRID’s in Snowflake. The other caveat is still geometry doesn’t map outside the worlds geometry.
https://github.com/charapa123/XC3-Python/blob/main/Colony%20Spatial%20Conversion.py Here is the python script used for the conversion. Essentially it defines the projection system I want to convert to then reads in the csv’s in the specified file path, defines the max x and y coordinates of the image, then adjusts the coordinates to fit the new SRID system.
Now that we have the points in the correct geometry we need to create a table in snowflake to input this data into.
In my case I had X,Y and Region, I then created a table defining these fields and now I have an empty table I can slot my data into. I will go through uploading data into snowflake tables in my next blog post.
CREATE TABLE REGIONS (
X AS VARCHAR(255)
Y AS VARCHAR(255)
REGION AS VARCHAR(255)
)
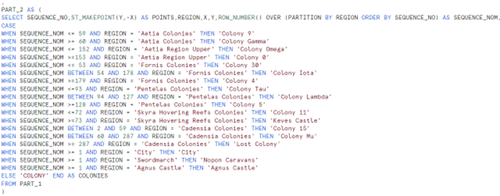
Now that we have our data in a snowflake table we can now query the data, first thing to note about the spatial data from the csv output of automeris is it is in the order that the points were plotted in. which meant in snowflake I had to assign the different colonies manually as there were multiple colonies per region.
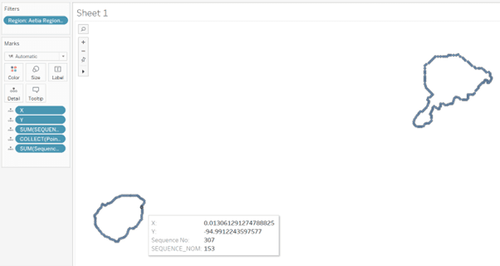
There is no way to view your spatial objects in snowflake so I created a view in which I used the snowflake connector to view the data in tableau to see if my data was in the correct format.
The first step is I didn’t have an order column which is needed to plot spatial points but as the data was already in the order I plotted manually in automeris, I wanted to create an ID field in Snowflake we can do this using the ROW_NUMBER() function and for this function to work in Snowflake without ordering by anything you need to order by select null. For Region shapes we needed a sequence starting at 1 for each region however when attempting to partition by region and start ID from each region, this would mess up the order so we first needed an overall ID to order the partition.


We now have our ID field but as there are multiple colonies per region we need to tell snowflake which points relate to which colony. This was difficult as we needed to identify the start and end point of each colony within a region. To do this I created a View in Snowflake and connected this to tableau, I then filtered to a region and put SEQUENCE NOM on detail to see which was the first and last point in each colony.
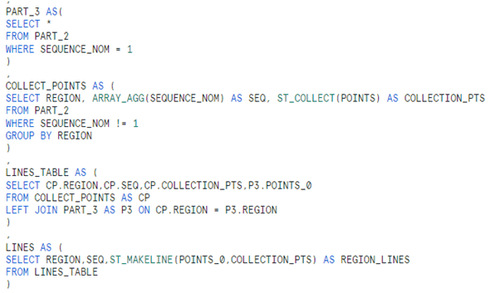
The next thing you need to know is creating Lines and polygons is a bit more complicated and essentially you need to find the start of the sequence so where our colony sequence equals 1 and keep these as points, then we also want where the sequence does not equal 1 and collect all these points into a single row with ST_COLLECT then combine these CTE’s so we can use the makeline function on our starting point and our collected points. Here is a blog explaining how to create Lines and polygons in Snowflake.
https://theinformationlab.nl/2022/10/03/geo-spatial-objects-in-snowflake/
One thing to note is that for polygons to be created in Snowflake there can be no gaps in the lines. As my spatial data was manually plotted there were gaps (where the start and end points did not connect) so polygons could not be made.
It’s great Snowflake can handle spatial data but there are some limitations currently.
Main Limitations:
· Can’t view spatial data in Snowflake
· Can’t read points outside worlds geometry
· Can’t create polygons if lines contain gaps
All my code for the spatial part of this project can be found at https://github.com/charapa123/XC3--SQL/blob/main/Regions%20and%20colonies.sql
The dashboard can be viewed below, scroll to the right to view full screen