

14 March 2017
Creating maps in Tableau is very easy, but using the default option in not always the best thing to do. The default in Tableau shows every detail of a country, jagged coastlines and remote islands off the coast. If your user just wants to compare sales between countries, then it can be better to use the simplest shapes you can get away with. Here is a map of Europe coloured by sales made with a) standard tableau map function b) simplified polygons: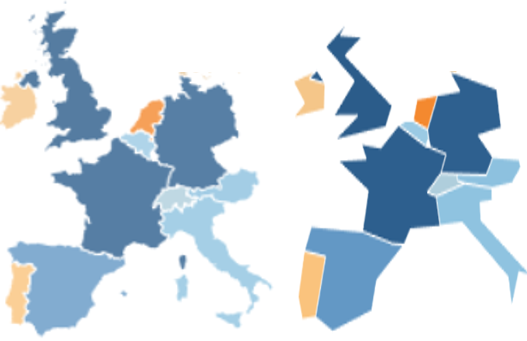
 1. Input the data, the csv you exported from Tableau.2. Create spatial points using lat and lon.3. Formula tool – Country & Polygon ID. Create a new field concatenating the name and sub-polygon id. This is because the poly-build tool in the next step can only group from one field – we need to group by the country and the polygon id.4. Poly-build: Build method = sequence polyline, Source field = centroid, Group field = name and polygon, sequence field = sub_polygon_id.5. Generalize. Choose a threshold distance that you want to generalize to. The bigger the number the more generalized your map will look and the less points each polygon will have. I went for 50 miles after some experimentation. It is easy to re-run the workflow with a different threshold later if you don’t like the result. Tick preserve consistency for entire layer to make sure that your country polygons all fit together after generalizing.6. Poly-Split. We need to get back to lat lon points that we can use in tableau. The first step is to split out polygon into points.7. Spatial Info – Centroid as X and Y Fields. The points created in the previous step were spatial points. The spatial info tool lets us get the latitude and longitude as doubles to use in Tableau.8. Formula tool – Country = Country & Polygon ID. We need another field that contains just the country. Some countries contain several polygons that do not touch (eg. Italy has several islands off the mainland) so we need to keep separate polygons for each country, but the country field is useful for filtering, highlighting or joins with other data.9. Regex – replace numbers with blank. This removes polygon ID so we just have the country name.The image below shows what mainland UK looks like when generalized:a) The original polygon (3,708 points).b) Generalized with a 10 mile threshold (89 points).c) Generalized with a 25 mile threshold (39 points).d) Generalized with a 50 mile threshold (12 points).
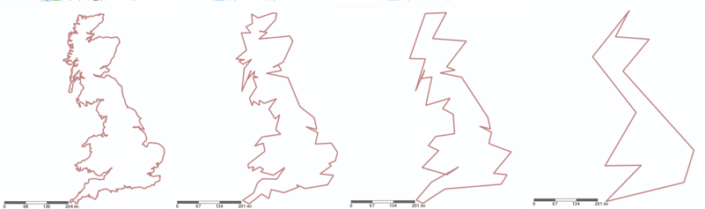
Get the country polygon data
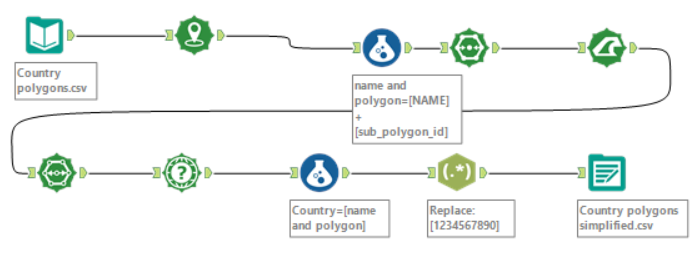
You can find the country polygons as a TDE at Tableaumapping.bi. There is also a packaged workbook that shows how the map is built from the data. To create the polygon map in Tableau, you just need to:• Put longitude and latitude on rows and columns• Put NAME (country) on detail• Put sub polygon id on detail• Put point order on pathIf you want to simplify the map, we need to get the data into Alteryx. Currently Alteryx cannot open TDEs, so first we need to export the data from Tableau as a csv.Click worksheet – export – data.Simplify the polygons in Alteryx
1. Input the data, the csv you exported from Tableau.2. Create spatial points using lat and lon.3. Formula tool – Country & Polygon ID. Create a new field concatenating the name and sub-polygon id. This is because the poly-build tool in the next step can only group from one field – we need to group by the country and the polygon id.4. Poly-build: Build method = sequence polyline, Source field = centroid, Group field = name and polygon, sequence field = sub_polygon_id.5. Generalize. Choose a threshold distance that you want to generalize to. The bigger the number the more generalized your map will look and the less points each polygon will have. I went for 50 miles after some experimentation. It is easy to re-run the workflow with a different threshold later if you don’t like the result. Tick preserve consistency for entire layer to make sure that your country polygons all fit together after generalizing.6. Poly-Split. We need to get back to lat lon points that we can use in tableau. The first step is to split out polygon into points.7. Spatial Info – Centroid as X and Y Fields. The points created in the previous step were spatial points. The spatial info tool lets us get the latitude and longitude as doubles to use in Tableau.8. Formula tool – Country = Country & Polygon ID. We need another field that contains just the country. Some countries contain several polygons that do not touch (eg. Italy has several islands off the mainland) so we need to keep separate polygons for each country, but the country field is useful for filtering, highlighting or joins with other data.9. Regex – replace numbers with blank. This removes polygon ID so we just have the country name.The image below shows what mainland UK looks like when generalized:a) The original polygon (3,708 points).b) Generalized with a 10 mile threshold (89 points).c) Generalized with a 25 mile threshold (39 points).d) Generalized with a 50 mile threshold (12 points).