

16 June 2015
One of my favourite parts of my job as a Tableau Consultant is receiving questions via our support desk which get the brain really ticking to find a solution. A question was sent the other day that a couple of colleagues and I collaborated on: how can I see Top N product sub categories, ranked, with all remaining sub categories shown as 'Other', also nested in customer segments?Here is the result they were looking for: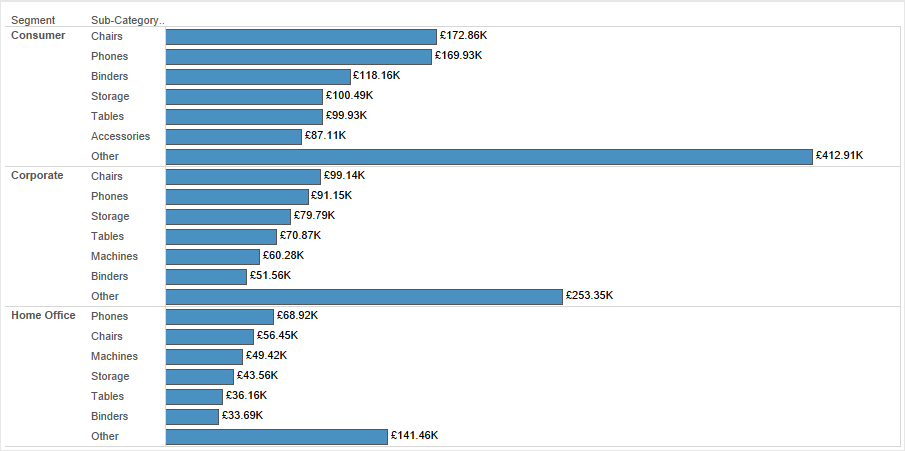 This looked like quite a common scenario, being able to show the Top N items (it could be customers by profit, or states by sales, or sales managers by sales), within a category, with all remaining items grouped as 'Other'. Should be straight forward?I first thought about using a Set or a Group to solve this problem. However Groups are static lists of dimension members, so we can't apply a Top N (but we could show 'Others'). Sets would allow us to do a Top N, but not display the 'Others'. A quick search on the Tableau Forums showed this great post started way back in 2010 - this was a good starting point, although the results in the post were not nested - so a few tweaks were to be made.The first step is to begin sketching out in Tableau the structure of our final view.
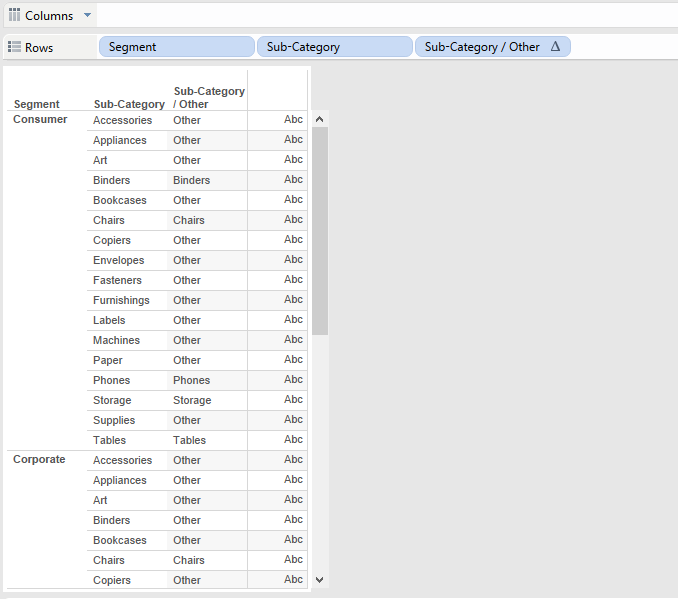 I took Segment and Sub-Category to Rows (notice I have removed Sub-Category from its hierarchy so the drill down function is avoided)Then I created a Parameter for my Top N
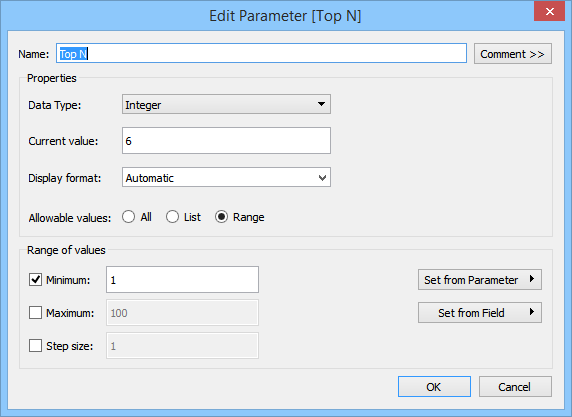 Next was to create a calculated field which would display the Sub-Category label if it was in the Top N, otherwise display 'Other':
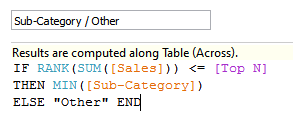 I added the new calculated field to Rows after Sub-Category, and displayed my Parameter control. The compute using for the new calculated field is Table (Down).Step 2 was to get our rows sorted in descending order of Sales, with Other always displayed at the bottom of each Segment.
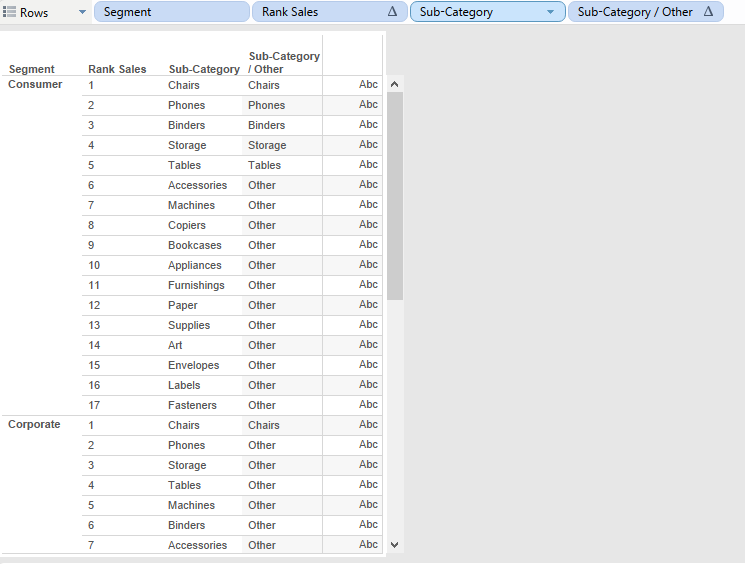 This was done by creating a Rank on Sales:
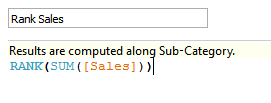 I then placed this on my Rows between Segment and Sub-Category. The compute using is set to Sub-Category. This means the rank is worked out for each Sub-Category, restarting (or grouped by) the Segment.Step 3 was to remove the duplication of the 'Others'.
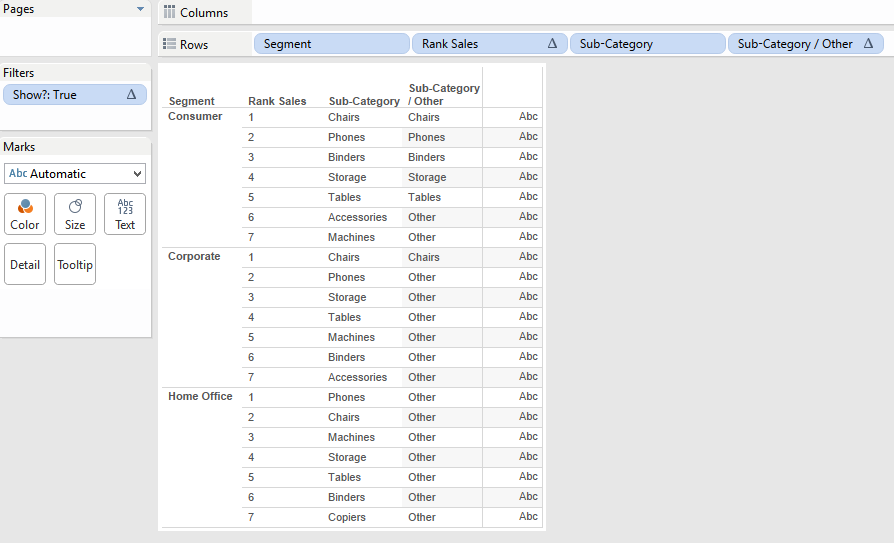 Again I created a new calculated field, 'Show?':
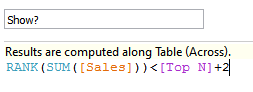 Place this on the filter shelf and select only 'True' values. This will remove any rows where the rank is greater than the Top N parameter value + 2. Make sure the compute using is set to Sub-Category for the filter to work correctly.Step 4 is to create a field which will display the Sum of Sales for the Top N members, and the total Sum of Sales for Others.
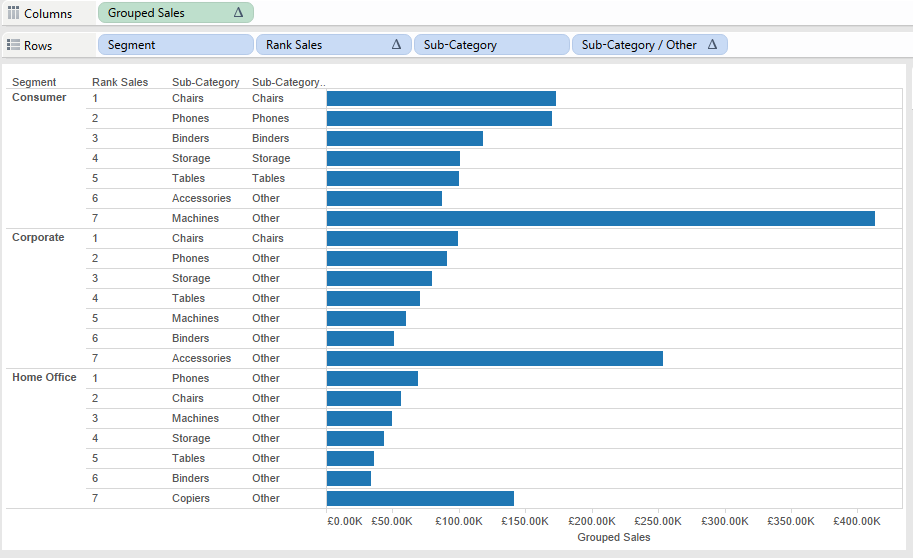 To do this we need to use a table calculation which will create the total for all the others:
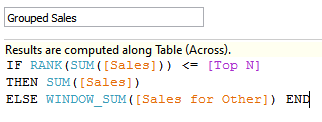 Placing this on columns will create a bar chart, alternatively you could place it on text to display a table. The compute using for this is also by Sub-Category.All that's left now is to make our chart looks presentable! I hid the Rank and Sub-Category headers. Then placed Grouped Sales on text to label the bars and hid the axis labels. I also added a border to the bars to make them stand out. I formatted the borders of the Row Dividers to show only a divider per segment, rather than one for each row. Lastly I edited the tool-tip to give only the relevant information to the end user.
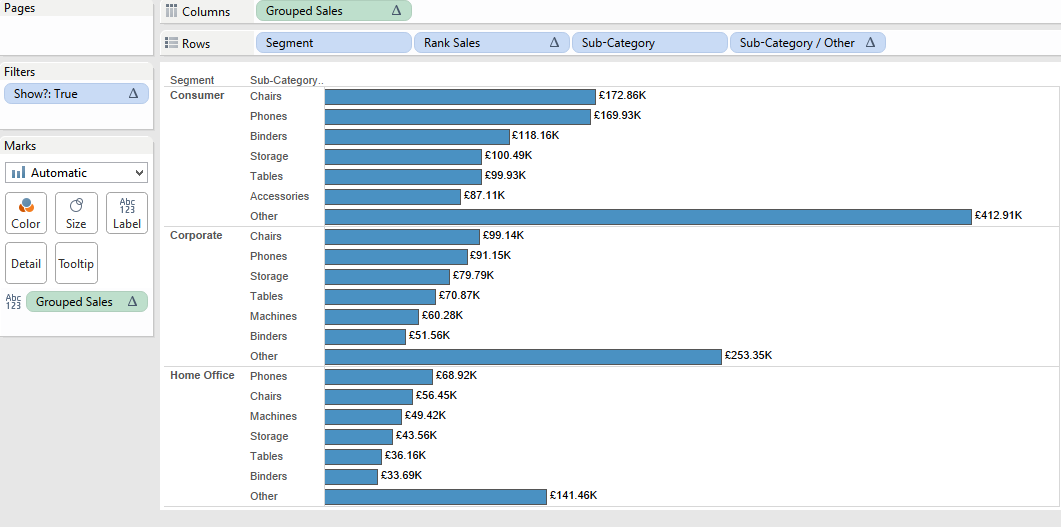 In the process of coming up with this answer the team and I came up with a few different solutions. As always with Tableau there is no one way to answer a question. If you have a different solution please feel free to comment!The workbook is available to download from Tableau Public too: https://goo.gl/2yKYJd
This looked like quite a common scenario, being able to show the Top N items (it could be customers by profit, or states by sales, or sales managers by sales), within a category, with all remaining items grouped as 'Other'. Should be straight forward?I first thought about using a Set or a Group to solve this problem. However Groups are static lists of dimension members, so we can't apply a Top N (but we could show 'Others'). Sets would allow us to do a Top N, but not display the 'Others'. A quick search on the Tableau Forums showed this great post started way back in 2010 - this was a good starting point, although the results in the post were not nested - so a few tweaks were to be made.The first step is to begin sketching out in Tableau the structure of our final view.I took Segment and Sub-Category to Rows (notice I have removed Sub-Category from its hierarchy so the drill down function is avoided)Then I created a Parameter for my Top NNext was to create a calculated field which would display the Sub-Category label if it was in the Top N, otherwise display 'Other':I added the new calculated field to Rows after Sub-Category, and displayed my Parameter control. The compute using for the new calculated field is Table (Down).Step 2 was to get our rows sorted in descending order of Sales, with Other always displayed at the bottom of each Segment.This was done by creating a Rank on Sales:Again I created a new calculated field, 'Show?':Place this on the filter shelf and select only 'True' values. This will remove any rows where the rank is greater than the Top N parameter value + 2. Make sure the compute using is set to Sub-Category for the filter to work correctly.Step 4 is to create a field which will display the Sum of Sales for the Top N members, and the total Sum of Sales for Others.To do this we need to use a table calculation which will create the total for all the others:Placing this on columns will create a bar chart, alternatively you could place it on text to display a table. The compute using for this is also by Sub-Category.All that's left now is to make our chart looks presentable! I hid the Rank and Sub-Category headers. Then placed Grouped Sales on text to label the bars and hid the axis labels. I also added a border to the bars to make them stand out. I formatted the borders of the Row Dividers to show only a divider per segment, rather than one for each row. Lastly I edited the tool-tip to give only the relevant information to the end user.In the process of coming up with this answer the team and I came up with a few different solutions. As always with Tableau there is no one way to answer a question. If you have a different solution please feel free to comment!The workbook is available to download from Tableau Public too: https://goo.gl/2yKYJd