

3 February 2015
In the previous show me, Jonathan touched on some history behind bar charts and explored the benefits of using them horizontally. At the end of the post he talked briefly about nested charts which is very similar to the topic on hand today, Side by Side bars.
In the previous show me, Jonathan touched on some history behind bar charts and explored the benefits of using them horizontally. At the end of the post he talked briefly about nested charts which is very similar to the topic on hand today, Side by Side bars.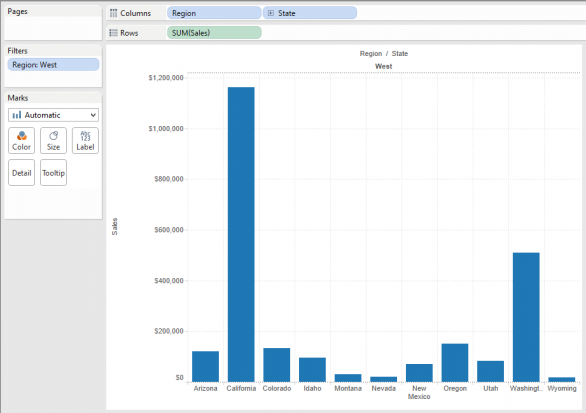 In seconds you'll have a chart, but what if you want to compare departments within each sate to see which departments are driving sales?In two mouse clicks you can turn this into a side by side bar chart. Here's how. Drag department onto the colour shelf and the whilst holding the control key on your keyboard, drag it from the colour shelf to the column shelf up top next to Sate. Holding control copies the pill so you don't have to move your mouse back to the dimensions list to grab it again. Now you can see within each state, which departments are driving sales and the departments are side by side, hence the name of the chart.
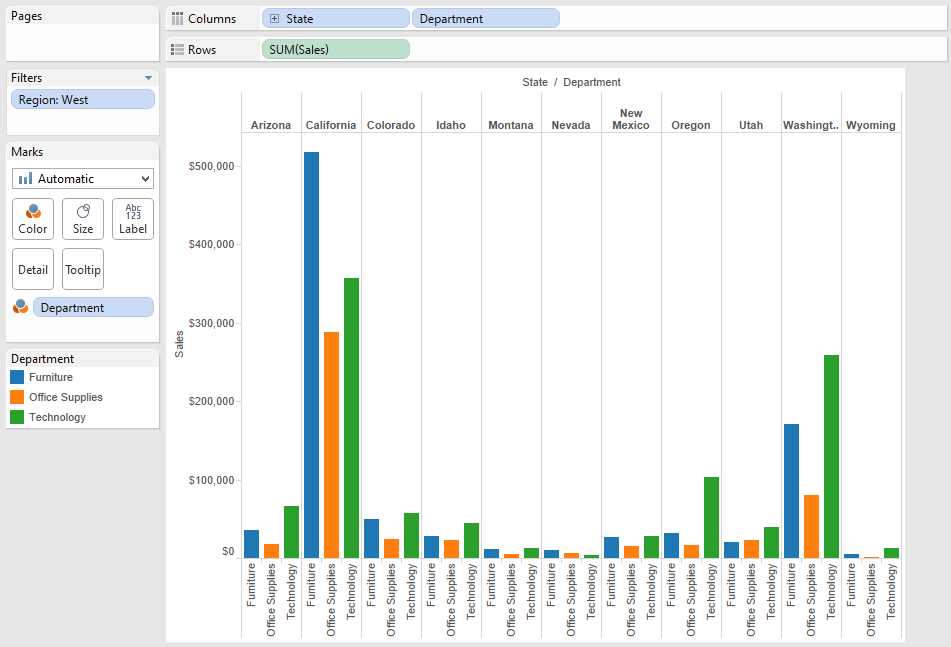 And that's it. The key thing to keep in mind is that you shouldn't use too many dimensions in a side by side bar chart or you start to loose the power of the chart style and that is the ability to see things next to each other.To make it easier to distinguish the states, you might consider using column banding in the formatting options and I also like to remove the header lines up top and bottom and adding some grid lines to make it slightly easier to distinguish the length of each bar.
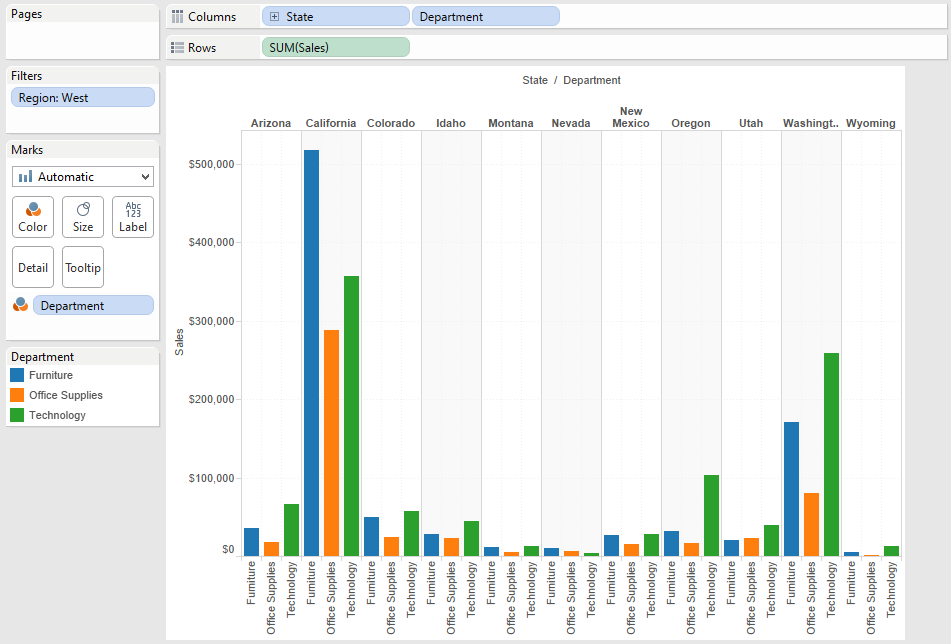 That's it!Stay tuned for more Show Me posts. If this is your first one, visit this index to see which show me posts you've missed and what's coming up next.
Side by Side Bars
These are handy when you would like to compare two or more dimensions or characteristics side by side. If we take Superstore sales as an example and we build out this basic view showing total sales by states in the West Region.In seconds you'll have a chart, but what if you want to compare departments within each sate to see which departments are driving sales?In two mouse clicks you can turn this into a side by side bar chart. Here's how. Drag department onto the colour shelf and the whilst holding the control key on your keyboard, drag it from the colour shelf to the column shelf up top next to Sate. Holding control copies the pill so you don't have to move your mouse back to the dimensions list to grab it again. Now you can see within each state, which departments are driving sales and the departments are side by side, hence the name of the chart.And that's it. The key thing to keep in mind is that you shouldn't use too many dimensions in a side by side bar chart or you start to loose the power of the chart style and that is the ability to see things next to each other.To make it easier to distinguish the states, you might consider using column banding in the formatting options and I also like to remove the header lines up top and bottom and adding some grid lines to make it slightly easier to distinguish the length of each bar.That's it!Stay tuned for more Show Me posts. If this is your first one, visit this index to see which show me posts you've missed and what's coming up next.