In this post I wanted to share a few simple tips regarding the inbuilt totals functions of Tableau. These are not tricky to do and that is why I have added this to the “Show me how” section. These features are available from at least v8.1 but there are a few new ones that have been added in v9 and I will point these out as we come to them.So to begin with the basics of turning on or off the totals within Tableau. For this example I will use a simple table of data but you could also apply these steps to charts as well.Step 1 – Create a plain table of dataUsing the superstore dataset I created a simple table of Sales and Profit per Country over the Categories and Sub-Categories. I also limited the countries to 3 so it was easier to screenshot. I’ve setup a “% of Total Profit” and “Rank of Sales” which I will use later on.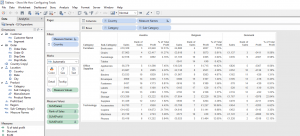 Step 2 – Turning on or off the Grand Totals from the menu optionsFrom the Analysis menu drop down to “Totals” and then across to “Show Row Grand Totals” and then do the same again for the Columns. In v9 you can also do this from the analysis tab behind the dimensions and measures pane. I have coloured these grand totals in blue.
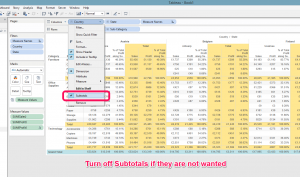
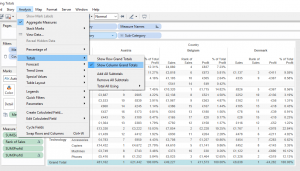 Step 3 – Turning on or off the Subtotals from the menu optionsThe Subtotals can also be turned on or off from the same menu location as the grand totals and can be done independently from the Grand Totals if you wish. In v9 you can also do this from the analysis tab behind the dimensions and measures pane. I have coloured these subtotals in yellow.
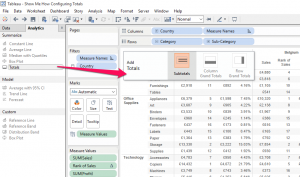 As one alternative you can turn on or off the subtotal from the appropriate pill on the shelf but only if you have already turned on the grand totals.
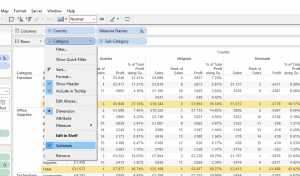 This is a great tip to learn as you can actually turn off either a row or column subtotal which you cannot currently do from the menu option which is all or nothing!For example if we expanded the Country pill to show Country and State on the Column shelf with all subtotals turned on we would get another Yellow section at the end of each country. We could then use the pill menu to turn off subtotals just for the country level and keep the subtotals for the categories
 In Tableau v9 you get a great little feature add which helps you stay in the flow. With the new tool tip functions you can now select either a grand total or a subtotal with a left click and then use the pop up tooltip to select “Remove”. This is the same as going to the Analysis menu and unticking each item but as mentioned it keeps you in the flow and it is a lot quicker.
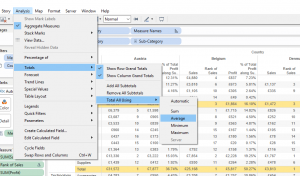
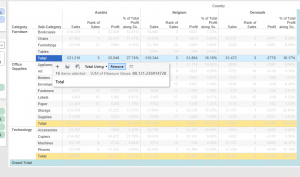 Personally I would love this tip even more if it worked more like the pill options to turn off just the one axis of subtotals and not all of them but that’s what the ideas pages are for :)Step 4 – Changing the aggregation of all totalsWhen a straightforward aggregation is being shown in the view that is not using any table calculations you can use the following options to change the way the total is calculated.To change all of the totals to use a different aggregation you can use the analysis menu and select “Total all using” to select how you would like the total to be created.
 In v9 you can also use the new tooltip options to set the aggregation of the totals and this is the same as using the analysis menu in that it will affect all totals.
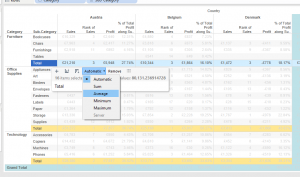
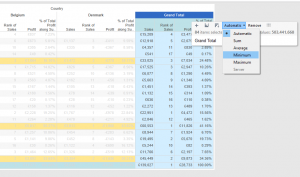 If you are following along in your own version you may be wondering why I went to the bother of making the “% of Total Profit” and “Rank of Sales”? Well this is because I wanted to show you the limitation of this “total using” option, it only works on non-table calculated measures. The “% of Total Profit” and the “Rank of Sales” are both calculated fields that are using table calculations. If you need to change the way this sort of field is calculated then you are moving away from the basics I’ll cover here but you can find some really great guides as listed below.
Great tip on how to customise your totals
Custom labels and totals
Custom totals in charts
Step 5 – Changing just one measure to be a different aggregationSo other than the above solutions to customise the totals I also found a great little built in feature that allows you more control over your totals other than just setting them all to be an average. If you click on a measure that is in you view you can use its drop down menu to select what aggregation to use and if wanted hide it completely if it does not make sense to show it as a total.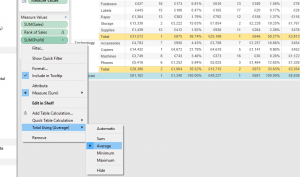 I hope this blog has given you some new information and that you can make use of this in the future. I have been using Tableau for a few years now and I only recently found all of these options.If you would like the workbook with the advanced table calculations being used in the total then you get it from the below tableau public
