

29 January 2015
In the next installment of our Show Me how series we are going to take a look at what is arguably the Daddy of all chart types, the bar chart (horizontal edition).The trusty bar chart is a staple of Tableau dashboards, Excel chart options and Powerpoint presentations, and rightly so. Its simplicity means virtually anyone can take insight from it. Equally, it’s also very hard to write a post about one, I mean what more is there to say, especially when later in this series we’ll be talking about stacked and grouped bars, so those are off the menu for this article.I suppose we could start with a definition, so off I go to Wikipedia, who helpfully offer up the following:“A bar chart or bar graph is a chart with rectangular bars with lengths proportional to the values that they represent. The bars can be plotted vertically or horizontally. The bars are used to show comparisons among categories. One axis of the chart shows the specific categories being compared, and the other axis represents a discrete value.”This now had me wondering where the hallowed bar chart originated, and Wikipedia once again came up with the goods:“The first bar graph appeared in the 1786 book The Commercial and Political Atlas, by William Playfair (1759-1823).”William Playfair was a Scottish engineer and political economist, and the founder of graphical methods of displaying statistics. Not only did he invent bar charts, but line graphs and pie charts (boo hiss) too! Here is apparently the first ever bar chart from the forementioned book: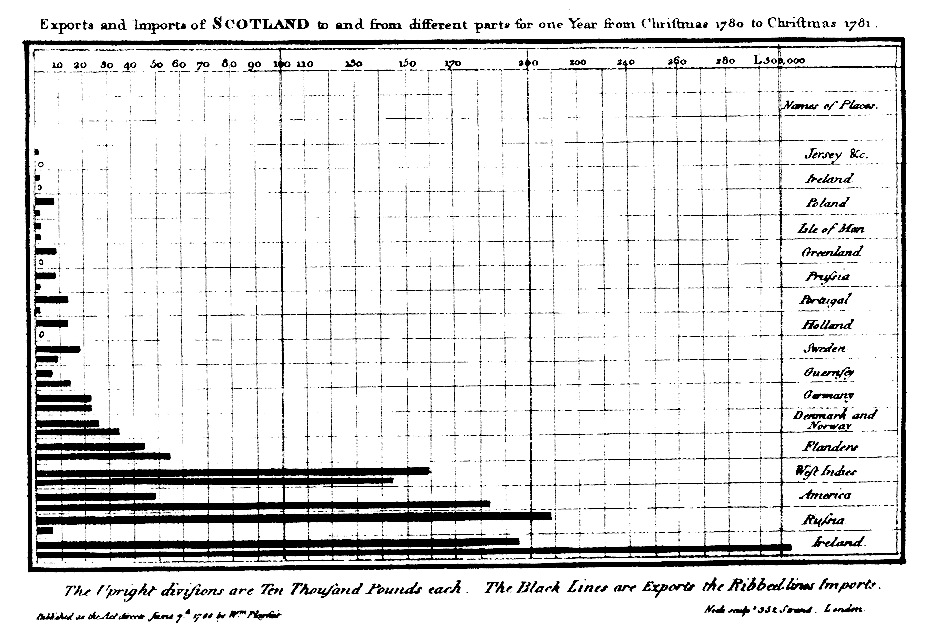
 There are a few things we could do to customise this chart, we could add labels for example to see what the value for each bar is. We could also add a reference line to show the average across all bars. One thing I like to do in tableau to help make a bar chart ‘pop’ is to increase the transparency and give the bars a light grey border, which you can do by clicking on the colour control on the marks shelf.
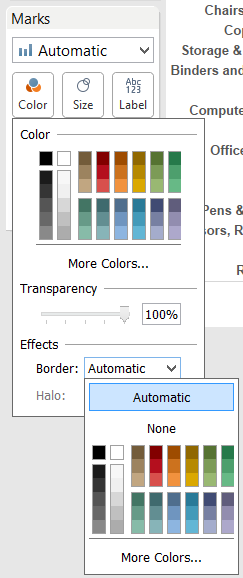
 Here ends this brief and simple post on horizontal bar charts, but there is so much more to discover once you get the hang of them - bar in bar charts, bullet charts, stacked and grouped bars - we'll be covering all these in later Show Me How episodes. For a full index of the series to date, take a look here.
Bar charts in Tableau
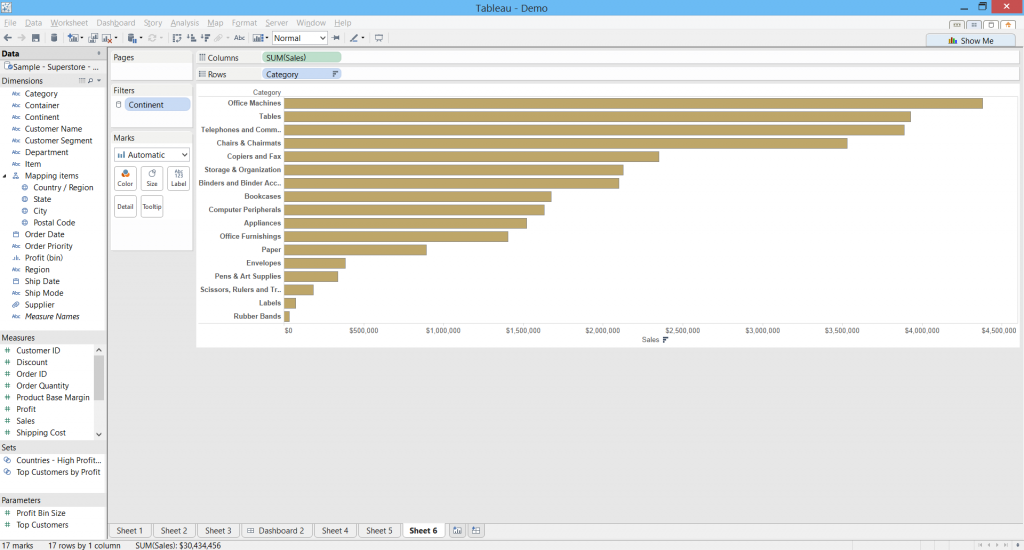
So, we now know what a bar chart is and where it comes from. But enough with the talk, let’s have a look at one using superstore data in Tableau. Creating one in Tableau is deceptively simple, and is probably the first chart that a new user is likely to create in Tableau. To make a horizontal bar chart, drag a dimension onto the rows shelf, and a measure onto the columns shelf.There are a few things we could do to customise this chart, we could add labels for example to see what the value for each bar is. We could also add a reference line to show the average across all bars. One thing I like to do in tableau to help make a bar chart ‘pop’ is to increase the transparency and give the bars a light grey border, which you can do by clicking on the colour control on the marks shelf.Sorting
However, probably the most important thing you want to do to enhance a bar chart is to sort the bars in descending (or ascending depending on your data) order. As the definition says, bar charts are for comparing the value of different categories, and sorting these really helps with the visual comparison. I won’t go into too much detail about sorting in Tableau – that’s a separate blog post in itself – but to sort a simple bar chart with one dimension, you can click on the sort buttons in the menu bar, or the sort button that appears when you hover over the top centre of the x axis, or right click on the dimension pill and select sort from the pop-up menu.Nested bar charts
Another great function of the bar chart type is that you can add more dimensions to the rows shelf to compare category values within a hierarchy of dimensions, for example, products within a product category, or cities within a state. A handy tip to employ here is to put the first (highest in the hierarchy) dimension onto the colour control so that the nested bar charts are visually distinct from each other. Note how I've also dropped the SUM(Sales) measure onto the label control so that the values of the bars appear as labels in the view.Here ends this brief and simple post on horizontal bar charts, but there is so much more to discover once you get the hang of them - bar in bar charts, bullet charts, stacked and grouped bars - we'll be covering all these in later Show Me How episodes. For a full index of the series to date, take a look here.