

29 September 2017
In the second part of this quick tour using the Tableau Service Now connector, some tips to work with time fields and some really fundamental stuff to use when analysing data from this serviceThis is the second and final part of an introduction to the ServiceNow Tableau connector. If you lost the first part, you can find it here. In the first part I did a summary of how to find the most common reported topics in ServiceNow. In this second part, I’ll talk a bit about time and priorities in this ticket service.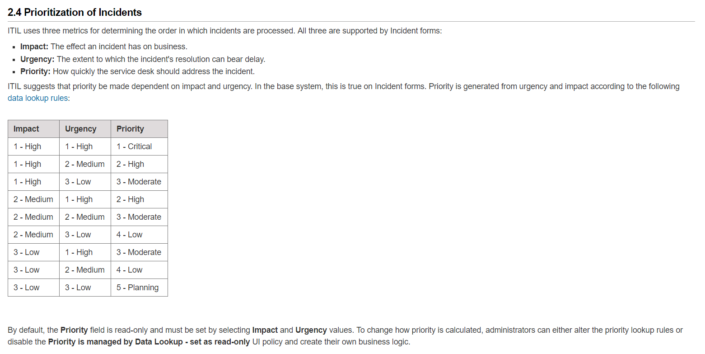
::Tip 5:: Why does the duration appear as a date in the 1970s?
Don’t panic if you find a value like '1970-01-01 04:00:00' when opening your duration field. It means the duration of your incidents was four hours.When using this field, all you need to do is to calculate the difference between the value shown and 1970-01-01T00:00:00Z. If you are wondering why the date in the 70’s (that was my first question when I saw it for the first time), it is the start of the Unix epoch.And what a hell is the Unix epoch? It is a system for describing a point in time, defined as the number of seconds that have elapsed since 00:00:00 Coordinated Universal Time (UTC), Thursday, 1st January 1970.::Tip 6:: What is the difference between “Duration” and “Business Duration”?
To understand this difference, it’s necessary to understand first what is the Service Level Agreement or SLA, a very useful and commonly used concept in ServiceNow – if you're going to work with this ticket service, you will hear this term a lot!The SLA is as a record which defines a set amount of time for a task to reach a certain condition. For instance, a critical incident should be closed within 24 hours. If the task does not reach the condition, it is marked as “breached”.But back to the different duration fields, the “Business Duration” is the time from opening to closure determined by the SLA calendar. Let’s imagine that your SLA calendar is set up for 8 working hours a day, Monday to Friday. If an incident opens on a Monday morning and closes in the end of Wednesday, it would display as 24 hours in the Business Duration field.However, the same incident would display as 72 hours in the “Duration” field.::Tip 7:: Priority, Impact and Urgency of an incident
If you drag and drop one of those fields you will find their values are numeric. The meaning of the values – and the logic behind them – is in ServiceNow documentation. Basically, the priority of a task is defined by a combination between the possible impact and the urgency defined by the user.To make your life easier, I'm sharing the correlation between those fields below (or you can check it here )::Tip 8: The schema map will be your best friend
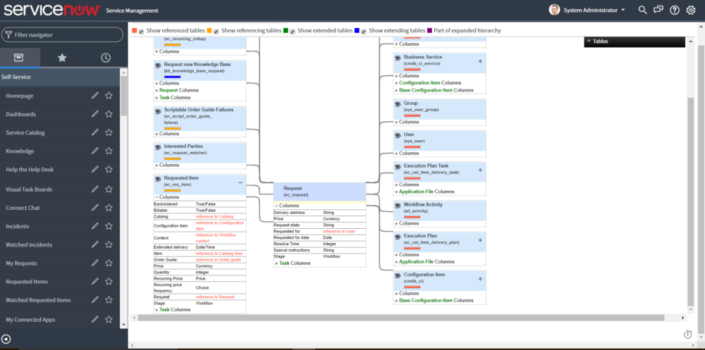
If you are serious about reporting using ServiceNow, better get used to the following navigation:- Go to
- In the Table Names pane, select a table.
- Click Schema map.
::Tip 9:: Using a developer instance?
If you’re using a developer instance to connect to ServiceNow, chances are you’ll need to wake it up before getting your data in Tableau. To do that, access the account first in the ServiceNow website and then open Tableau and connect or refresh your data.Already an user of ServiceNow ITMS connector? Share your tips in the comments!