


Polygon Pop Art is one of the most fun projects I’ve done this year. I was first inspired to play around with polygons in Tableau by the beginner drawing class I’m taking.We learned that basic shapes are the foundation of any drawing. I also learned that I am not a gifted artist. My simple shape sketches looked better than the final product 99% of the time. One of the first things I tried to draw was my French Bulldog.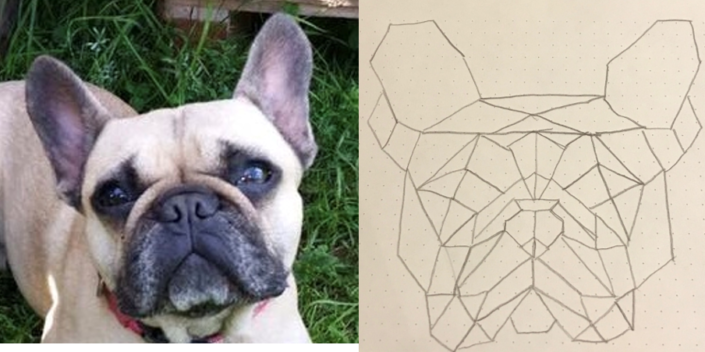 I looked at my simple shapes sketch and thought, I bet I could do this in Tableau!Brian Prestidge and Niccolo Cirone both wrote great blogs about how to polygon-ize images. The techniques they describe work well when your image is made up of distinct separate shapes that you can then turn into polygons. However, my image is made up of many connected polygons so I opted for a more low-tech solution of plotting the polygons by hand.
The Process
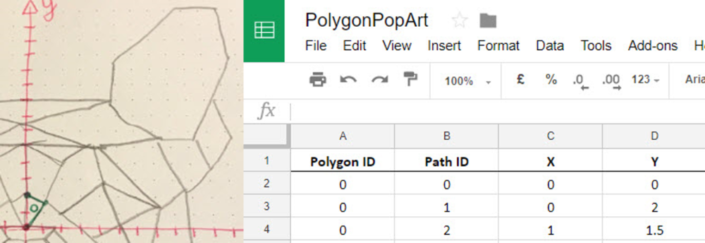
First, select a drawing made up entirely of polygons. Polygons are points connected by lines enclosing an area. This means your drawing must not contain any curved lines.Second, overlay an x-y plot on top of your drawing. In my case, I simply picked a spot in the center of my picture and added x and y axises.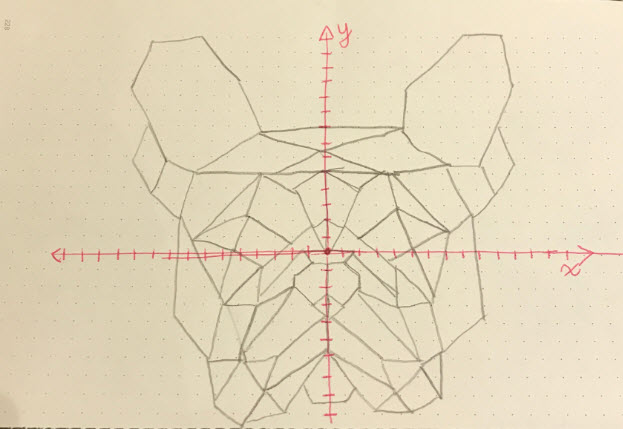 Third, we are ready to start creating our dataset. For each polygon, we need to record the PolygonID, the X, Y coordinates of each point, and the PathID to tell Tableau the order you want the points connected in. I choose to record my data in GoogleSheets, but you can also use Excel.
Creating the Dataset
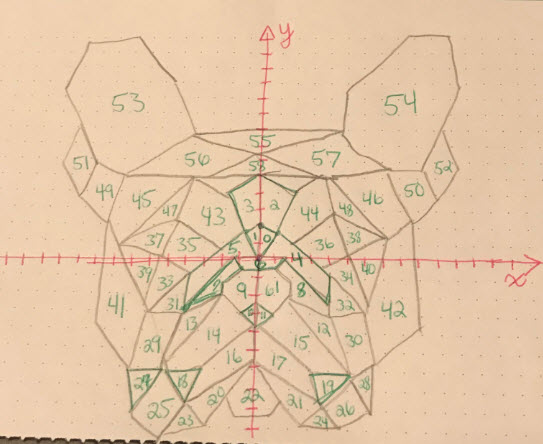
 I definitely underestimated how long the dataset creation step would take. I recommend starting with a drawing 5 - 10 polygon shapes. My drawing had 61 polygons.
Tableau
The final step is to move into Tableau and create your polygon Dashboard.
Connect to your dataset, in my case Google Sheets
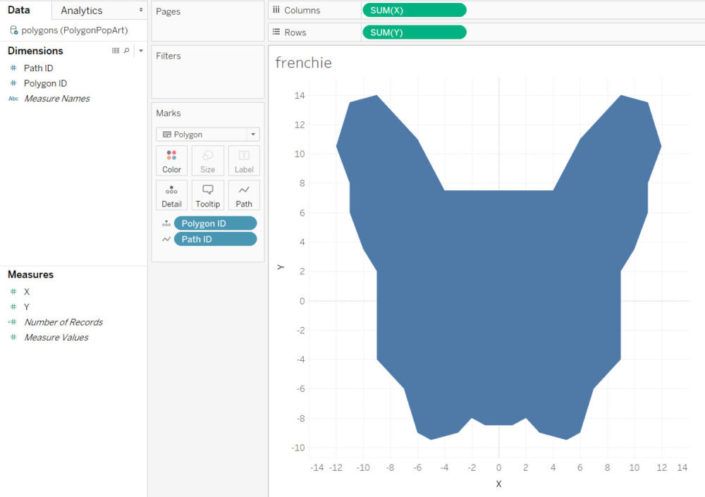
Drag [X] to Columns, and [Y] to Rows
Change the Mark type to Polygon
Drag [PolygonID] to Detail
Drag [PathID] to Path
Turning my Tableau Frenchie into Pop Art
The hard part is done! The transition from Tableau Frenchie to Polygon Pop Art comes down to formatting and color selection.I cleaned up the viz by turning off Tooltips, deselecting Show Headers for [X] and [Y], and turning off all grid lines.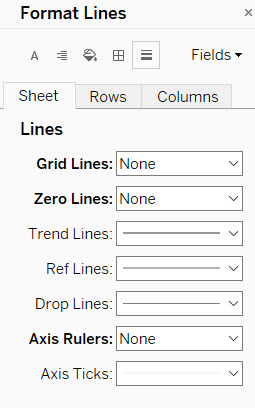 I added [PolygonID] to Color and changed the shading on the worksheet.
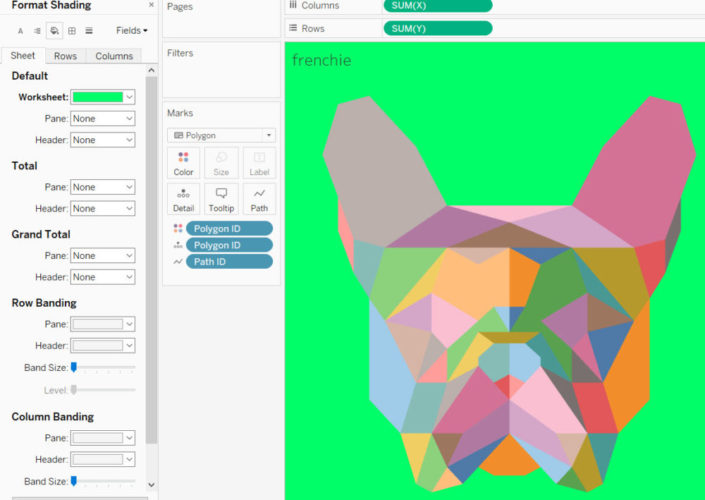 Next, I duplicated the worksheet three times. In order to change the colors of my polygons in the new sheets without it affecting my original worksheet, I created calculated fields. I created [Color1], [Color2], and [Color3] all with the same formula and replaced [PolygonID] on Color on the respective worksheets.
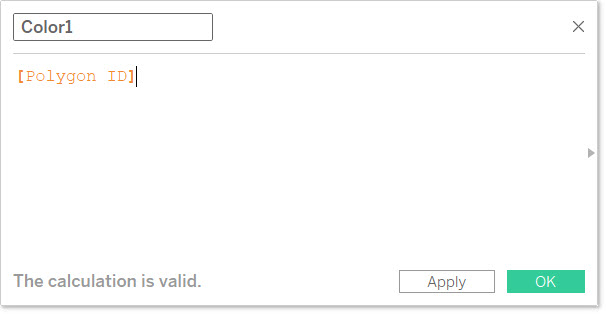 Then I played around with color palettes till I found ones I liked and changed the worksheet shading on each new sheet.Finally, I arranged my worksheets on a dashboard and Voila!
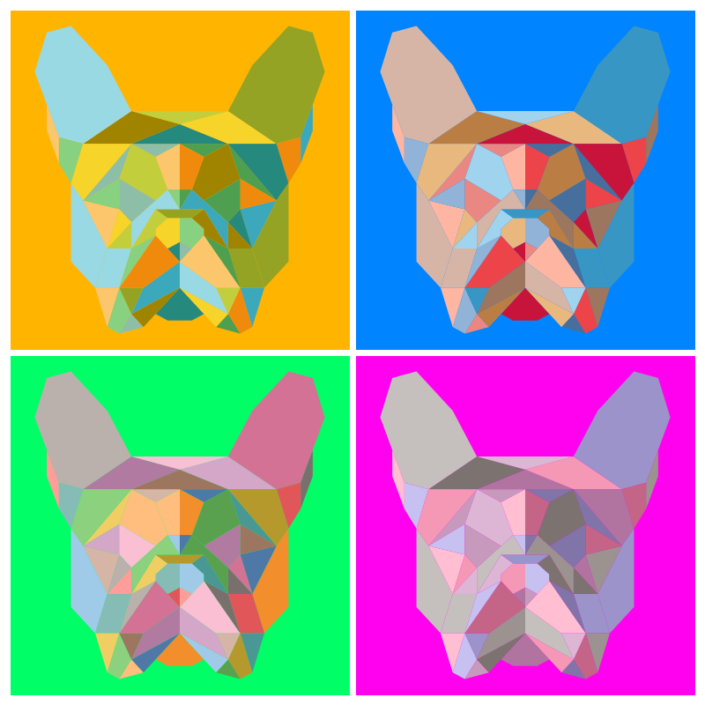 Click on the image to go to the view