

26 February 2015
The Information Lab consultants are involved in numerous data visualisation projects. Building corporate dashboards not only serves reporting purposes but gives users a way to interrogate their data, to explore along their user journeys and gain business insights. Tableau, being a very user friendly and versatile software makes the technical aspects easy, once we know what we want to build. In every corporate data visualisation / visual analytics project there is a phase before we even open Tableau. This is the planning phase. This blog post will be less technical as it deals with the project management facet of data visualisation. The process I share is arbitrary, this is how I like to approach it but it does not mean that this would be best practice. Data exploration with Tableau is a liberating experience and optimally we arrive to the final dashboards through 'asking' our data various questions in close cooperation with the business so we discover many 'stories' besides the one we initially had in mind. One thing worth mentioning is that the following process is most useful when working towards a stricter deadline that limits the number of iterations in dashboard structure and design.So how can we structure the process in terms of planning our work?Phases in building corporate dashboards (the ’insight’ process)
 Continuing the above example the user journey design can be:’Users will at first see the global results with the major KPIs for the total brand portfolio as well as a map to get a country overview. This global overview can also cover the product categories’ performance globally. Then the user can drill down to specific countries or specific product categories to explore the brand performances in that country or product category. Once the user arrived to a country or product category and selects a relevant brand, they should be able to explain the reasons of brand performance like pricing or detailed brand KPIs. If a user wants to restart the analysis, they will do it from the topline, global page and drill-down to a different country or different product category.’This does not have to be a written brief, it can be a simple discussion in a meeting. Still, this is highly useful for a Tableau Consultant as this analytical narrative can be translated to the...3. Dashboard layout designWhat is this exactly? We still do not have to open Tableau to complete this step, a pen and paper will just do. So does Powerpoint. Let’s see the sketch of our example.
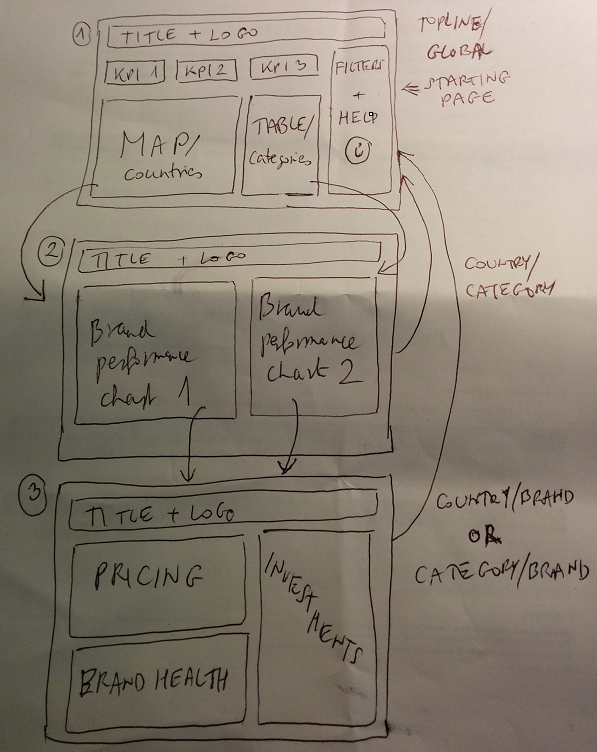 At this phase we do prompt for further requirements or suggest refinements (how many filters, how to split the data, time horizon, do we want to switch between multiple KPIs in the views, color codes, company specific calculation formulae, etc.) but the collected information builds up to enable a draft Tableau version, via the...4. Technical executionThis is fully the resort of the Tableau Consultant. Having understood the business requirements and the data we create the draft version in Tableau. It is also time to add features that will enhance the user experience and data exploration. These may be insightful, newly calculated fields, additional actions, user guides, more details in tooltips, links within the workbook to guide user navigation. It is also our task to provide the best chart types to express the data. From now on it is still an iterative process as our business partner may have new ideas, extra features or require a drill-down to even more details but the structure, the logic of the workbook should not change fundamentally. It is interesting to notice that in general the tree structure of the user journey (the analytical route) translates to the physical workbook structure as users start on a landing page and 'travel' from there in different directions. Another way to build Tableau reports is to have a 'Contents' sheet with links to the analytical sheets but I do not recommend it. Tableau reports sometimes end up like that because no user journey (thus tree structure or funnel) was identified at the beginning and there is no priority order and connection among the dashboards.This soft project management part of building Tableau dashboards may seem too strict as anyway Tableau is so fast in creating dashboards, why not just go by trial and error and iterate with the business? Believe me, you can spare considerable time by some foreward thinking, either you are working directly with the software or you are the one defining business requirements and briefing Tableau consultants. Moreover, laying out the precise business requirements (user journey and basic dashboard layout) can have an impact on how we clean and structure the data for the session in Tableau.If you are responsible for technically creating the dashboards, ask a lot and try to understand the business. If you represent the business, I suggest to pro-actively share your thoughts and be involved in the user journey definition phase. Rarely is a harder situation for Tableau consultants when we are presented with the data and left alone to bring our own recommendations. The result will be valuable but it can only match the (uncommunicated) expectations by chance.So communication is key in the process.
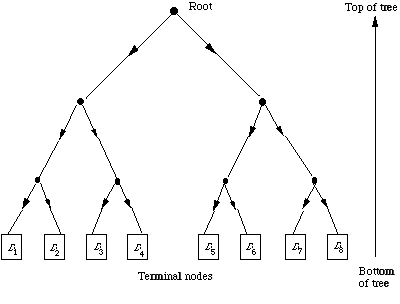
- Business insights list
- User journey design
- Dashboard layout design
- Technical execution
Continuing the above example the user journey design can be:’Users will at first see the global results with the major KPIs for the total brand portfolio as well as a map to get a country overview. This global overview can also cover the product categories’ performance globally. Then the user can drill down to specific countries or specific product categories to explore the brand performances in that country or product category. Once the user arrived to a country or product category and selects a relevant brand, they should be able to explain the reasons of brand performance like pricing or detailed brand KPIs. If a user wants to restart the analysis, they will do it from the topline, global page and drill-down to a different country or different product category.’This does not have to be a written brief, it can be a simple discussion in a meeting. Still, this is highly useful for a Tableau Consultant as this analytical narrative can be translated to the...3. Dashboard layout designWhat is this exactly? We still do not have to open Tableau to complete this step, a pen and paper will just do. So does Powerpoint. Let’s see the sketch of our example.At this phase we do prompt for further requirements or suggest refinements (how many filters, how to split the data, time horizon, do we want to switch between multiple KPIs in the views, color codes, company specific calculation formulae, etc.) but the collected information builds up to enable a draft Tableau version, via the...4. Technical executionThis is fully the resort of the Tableau Consultant. Having understood the business requirements and the data we create the draft version in Tableau. It is also time to add features that will enhance the user experience and data exploration. These may be insightful, newly calculated fields, additional actions, user guides, more details in tooltips, links within the workbook to guide user navigation. It is also our task to provide the best chart types to express the data. From now on it is still an iterative process as our business partner may have new ideas, extra features or require a drill-down to even more details but the structure, the logic of the workbook should not change fundamentally. It is interesting to notice that in general the tree structure of the user journey (the analytical route) translates to the physical workbook structure as users start on a landing page and 'travel' from there in different directions. Another way to build Tableau reports is to have a 'Contents' sheet with links to the analytical sheets but I do not recommend it. Tableau reports sometimes end up like that because no user journey (thus tree structure or funnel) was identified at the beginning and there is no priority order and connection among the dashboards.This soft project management part of building Tableau dashboards may seem too strict as anyway Tableau is so fast in creating dashboards, why not just go by trial and error and iterate with the business? Believe me, you can spare considerable time by some foreward thinking, either you are working directly with the software or you are the one defining business requirements and briefing Tableau consultants. Moreover, laying out the precise business requirements (user journey and basic dashboard layout) can have an impact on how we clean and structure the data for the session in Tableau.If you are responsible for technically creating the dashboards, ask a lot and try to understand the business. If you represent the business, I suggest to pro-actively share your thoughts and be involved in the user journey definition phase. Rarely is a harder situation for Tableau consultants when we are presented with the data and left alone to bring our own recommendations. The result will be valuable but it can only match the (uncommunicated) expectations by chance.So communication is key in the process.