22 October 2014
I start this post with a very theoretical definition of the weighted average, where instead of each of the data points contributing equally to the final average (as with the simple arithmetic mean), some data points contribute more than others. These ’contributions’ are called weights.That is clear but how does it link to Tableau and aggregating data? Let me start from a bit farther away....What is aggregation?Before defining ’aggregation’, let’s see when we use it. Our data sources usually / optimally contain disaggregated data, meaning each row in the data file refers to the smallest individual entity we have information about and we see different measures at this level, let it be:- a single product variant’s sales value in a country,- a respondent’s evaluation score to a specific market research question or- the duration of a distinct call that a call center received, etc.Tableau’s power is in its ability to ’roll-up’ this highly granular, item level data to higher, more and more topline level. Sticking to the earlier examples these higher levels may be- a brand’s sales value in the country (made up of its brand variants),- a brand’s sales value in a region (made up of its product variants’ performances in the countries within the region) or- the total duration of all the calls the call center received within a specific day. In these cases we are no longer analyzing individual rows in our dataset but combining them along similarities (like the brand they belong to or the region they belong to or the day they belong to).This process of viewing numeric values (measures) at higher, more and more summarized levels of the data is ’aggregation’. So when aggregating we move from the very details to summary while disaggregating means we split the results back to row level, technically speaking.Aggregation has several types. ’Type’ refers to what we calculate from the numeric values when we roll-up the data. Is it the sum, average, median, etc.? Tableau offers various aggregation types but this post is not about discussing these options.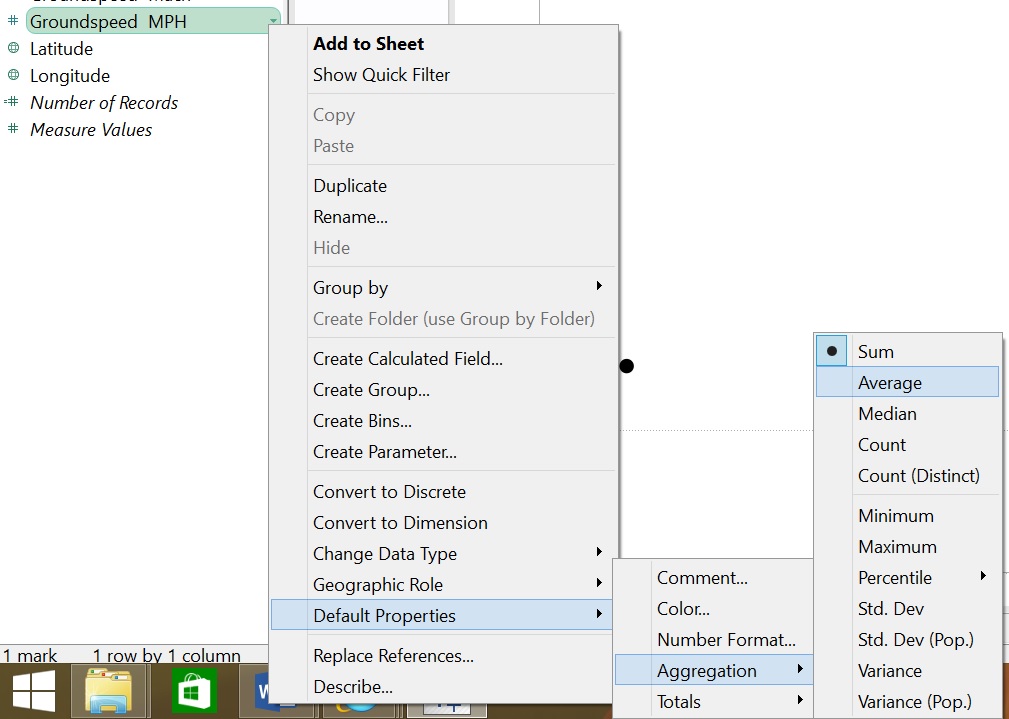 A calculated field’s results can be:
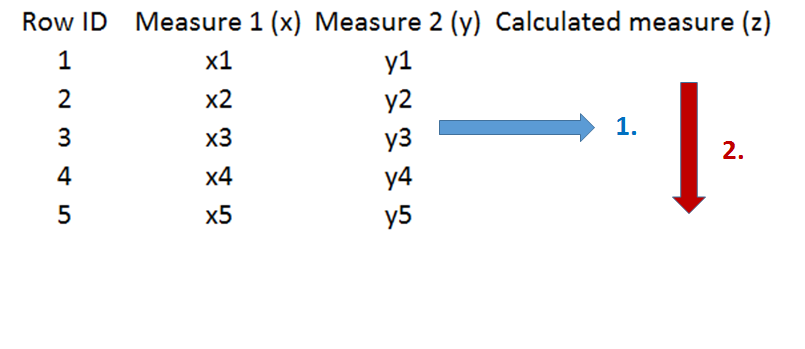 2. first AGGREGATE then CALCULATE:
 OK, enough of the theory, moving on to tangible data.We have a small data file containing an imaginary company’s UK projects’ variable cost and total cost in 2013. Each row represents data of a Project ID being the lowest level of detail.
 This dataset will be used to calculate two mesures:Fixed Cost = Total Cost – Variable CostVariable Cost Ratio = Variable Cost / Total CostWe create both measures in two ways in Tableau, as an aggregate measure (including the aggregation type right in the formula) and as a non-aggregate measure (not including any aggregation type in the formula, leaving the calculation at row level).So, what do these formulas look like?
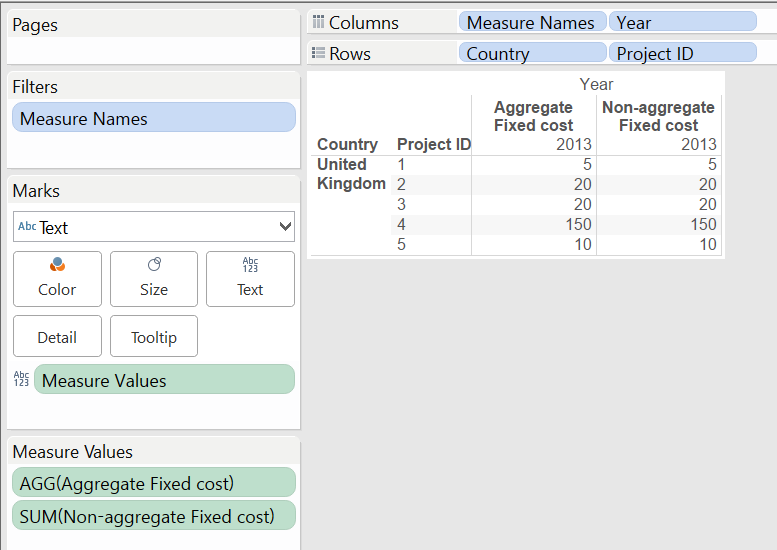
 You may also notice that there is another mathematical difference between the two columns. Fixed Cost works with subtraction while Variable Cost Ratio is calculated by a division. This will come into play later on. It is also important to mention that ’aggregate’ really means here ’pre-aggregated’. So there is an aggregation type (SUM in this case) already defined in the formulas of these fields.How do these calculated measures behave when we apply them in visualisations?1A) Fixed Cost – at a disaggregate (row level = Project ID) level of data
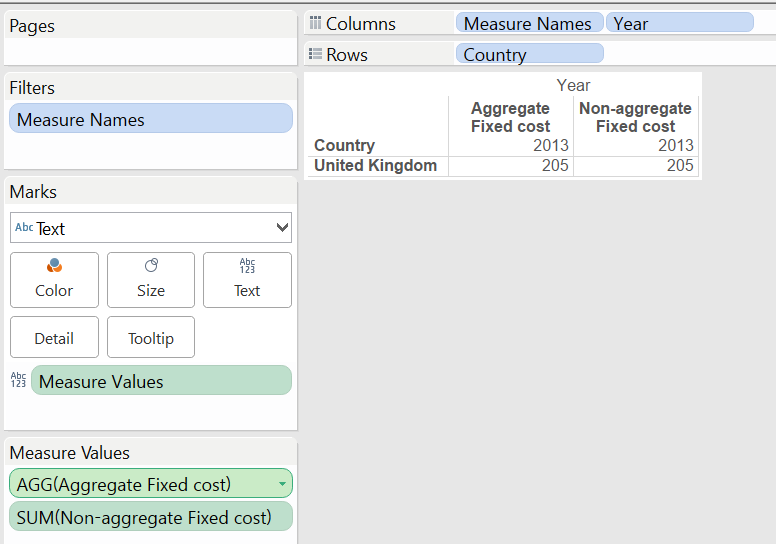
 1B) Fixed Cost – at an aggregate level of data (not at Project ID level)
 What is happening in the background?
 Due to the mathematical nature of subtraction or addition, with these operations we receive the same result, no matter in which order we aggregate the results.2A) Variable Cost Ratio - at a disaggregate (row level = Project ID) level of data
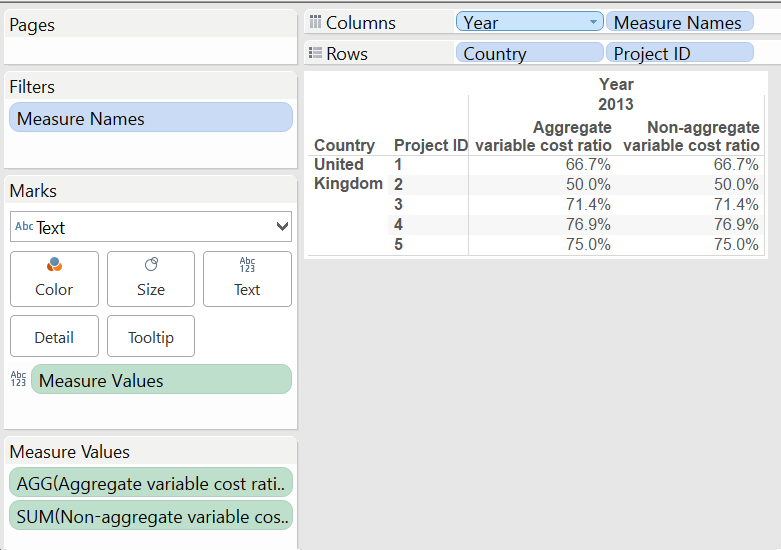 No surprise that the results of the aggregate and initially non-aggregate measure match if we work with row level data. Did you notice that I wrote ’initially’ non-aggregate measure? Talking about calculated fields there is nothing like ’non-aggregate’ measure in Tableau. Sooner (in the formula) or later (when placed in the view) we have to attach an aggregation type (e.g. SUM, AVG, etc.) to our measure. Of course when working with row level data, the aggregation type chosen does not change the results. Even if we selected AVG or MIN or MAX as the aggregation type of the initially non-aggregate variable cost ratio measure, it would have produced the same results in the view because we are dealing with ONE DATA POINT at a time here...The difference between preaggregated and initially non-aggregate measures also manifests in the prefix they receive in the measure values shelf. A pre-aggregated measure is shown as AGG(Measure name) while the initially non-aggregated measure is displayed as SELECTED AGGREGATION TYPE(Measure name).
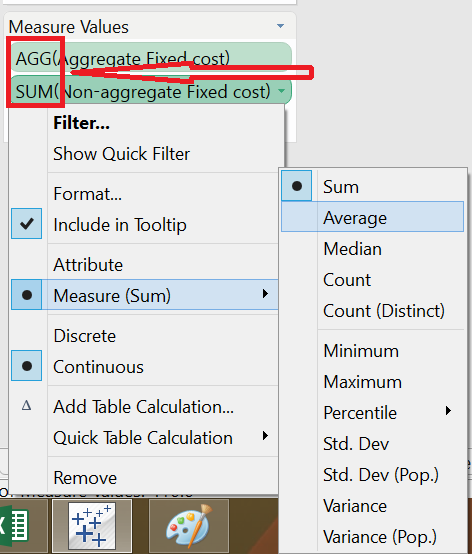 It is useful to know that the aggregation type of a pre-aggregated measure cannot be changed in the view. You have to change the formula of this calculated field to change its aggregation type.
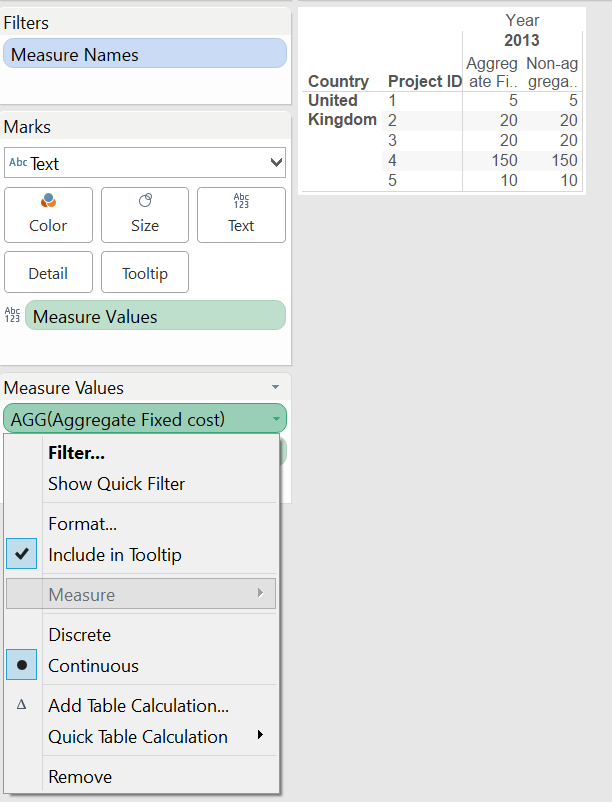 2B) Variable Cost Ratio – at an aggregate level of data (not at Project ID level)
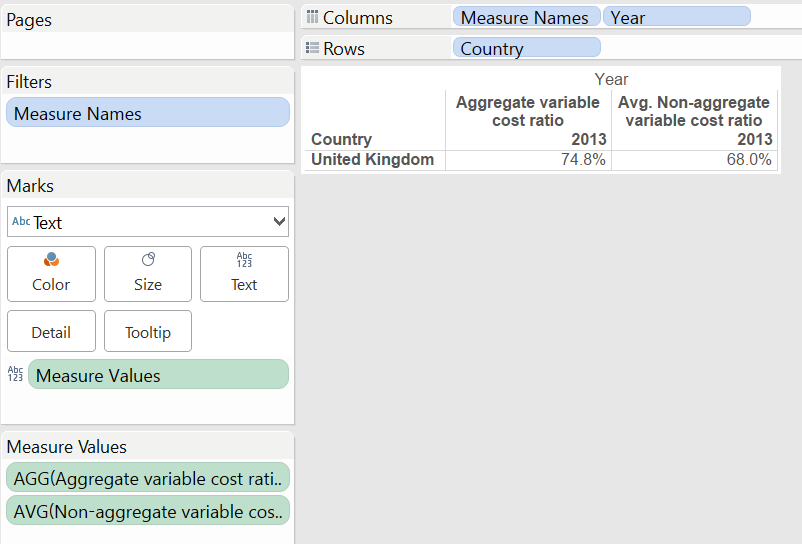 The default aggregation type Tableau selects when we place a non-aggregate measure in the view is SUM. Hey, what if we change it to AVG (average), why is it still not producing the correct figures?To understand this, we have to check what is happening in the background.
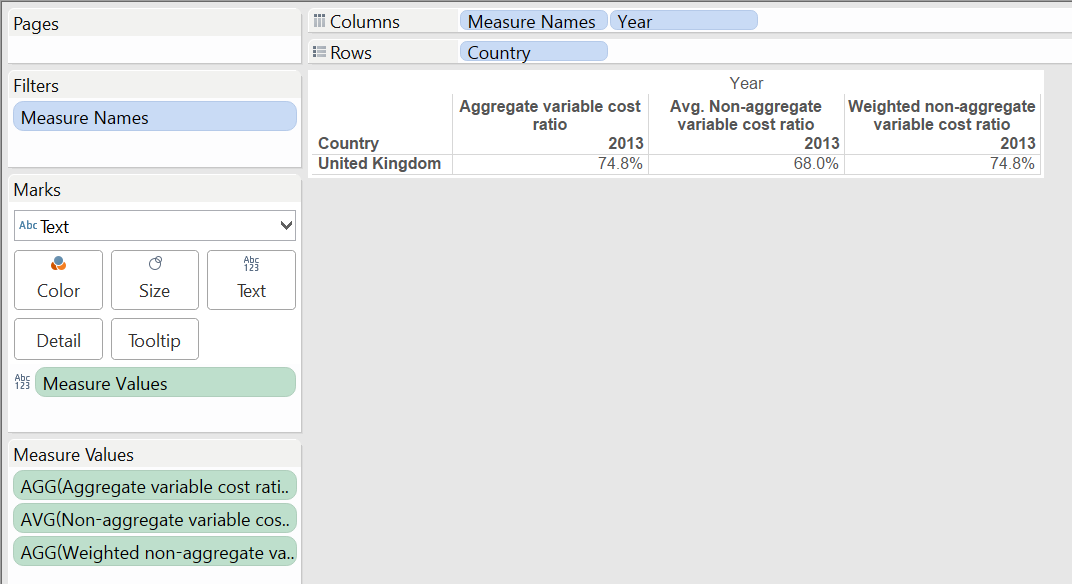
 Clearly, calculating from the row level and then aggregating leads to a false result of 68.0% vs the correct 74.8%. The aggregated variable cost ratio is not a simple average of the Project ID level results but a weighted average where the weights are the Total Cost figures by Project ID. Naturally it does matter whether a 20% variable cost ratio is reached on a Total Cost of 100 or 1.000.000.The respective calculation of the weighted average (as would be seen in Excel) is at the bottom row of the below table, building on the well-know SUMPRODUCT function:
 How can we achieve this in Tableau? We do not find ’weighted average’ in the default aggregation types so we have to compile a formula to express it.
 Wait, we just arrived back to the original, pre-aggregated variable cost ratio formula... Hence having the weighted average in the view, we see that it is identical to pre-aggregated calculated measure.
 Finally, let’s see a summary table of how non-aggregate and aggregate calculated fields work.
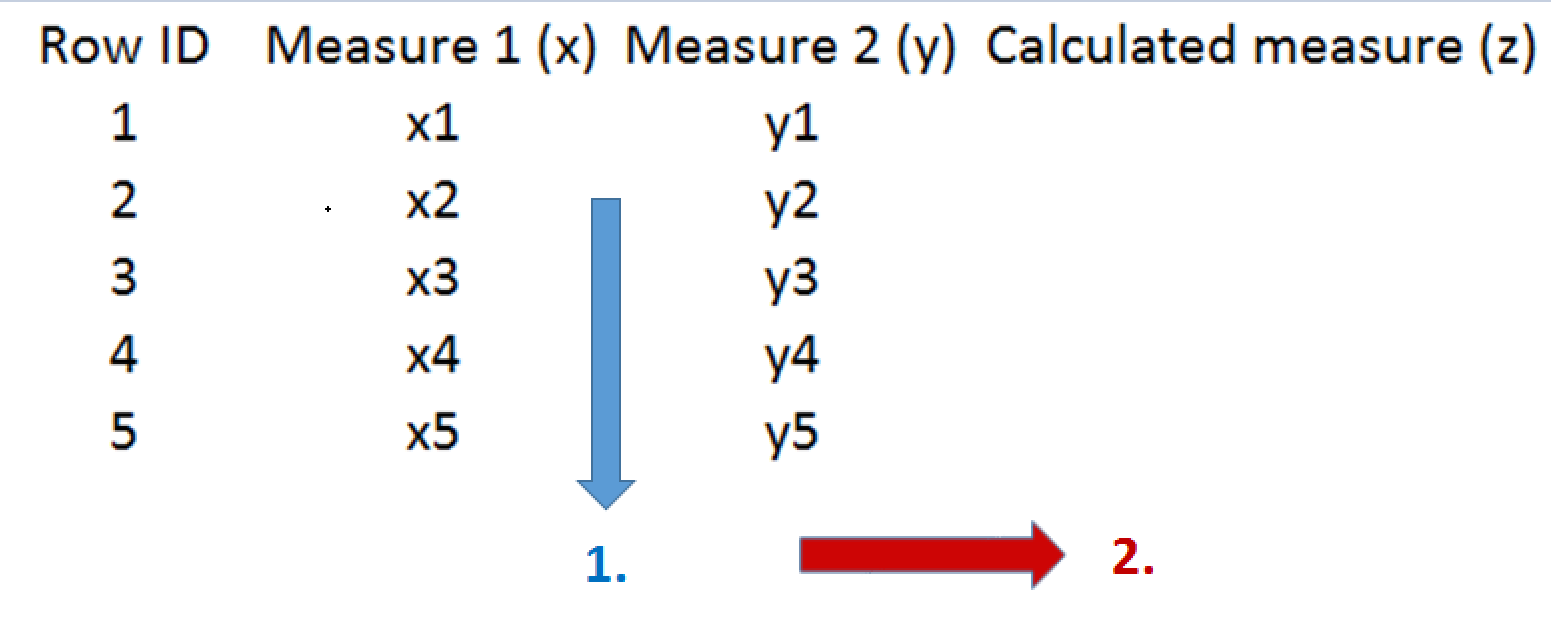
 A calculated field’s results can be:
- calculated at row level and then those row level results can be ’rolled-up’/aggregated or
- the factors in the formula can be aggregated first to a higher level where the calculation is done.
 2. first AGGREGATE then CALCULATE:
 OK, enough of the theory, moving on to tangible data.We have a small data file containing an imaginary company’s UK projects’ variable cost and total cost in 2013. Each row represents data of a Project ID being the lowest level of detail.
 This dataset will be used to calculate two mesures:Fixed Cost = Total Cost – Variable CostVariable Cost Ratio = Variable Cost / Total CostWe create both measures in two ways in Tableau, as an aggregate measure (including the aggregation type right in the formula) and as a non-aggregate measure (not including any aggregation type in the formula, leaving the calculation at row level).So, what do these formulas look like?
 You may also notice that there is another mathematical difference between the two columns. Fixed Cost works with subtraction while Variable Cost Ratio is calculated by a division. This will come into play later on. It is also important to mention that ’aggregate’ really means here ’pre-aggregated’. So there is an aggregation type (SUM in this case) already defined in the formulas of these fields.How do these calculated measures behave when we apply them in visualisations?1A) Fixed Cost – at a disaggregate (row level = Project ID) level of data
 1B) Fixed Cost – at an aggregate level of data (not at Project ID level)
 What is happening in the background?
 Due to the mathematical nature of subtraction or addition, with these operations we receive the same result, no matter in which order we aggregate the results.2A) Variable Cost Ratio - at a disaggregate (row level = Project ID) level of data
 No surprise that the results of the aggregate and initially non-aggregate measure match if we work with row level data. Did you notice that I wrote ’initially’ non-aggregate measure? Talking about calculated fields there is nothing like ’non-aggregate’ measure in Tableau. Sooner (in the formula) or later (when placed in the view) we have to attach an aggregation type (e.g. SUM, AVG, etc.) to our measure. Of course when working with row level data, the aggregation type chosen does not change the results. Even if we selected AVG or MIN or MAX as the aggregation type of the initially non-aggregate variable cost ratio measure, it would have produced the same results in the view because we are dealing with ONE DATA POINT at a time here...The difference between preaggregated and initially non-aggregate measures also manifests in the prefix they receive in the measure values shelf. A pre-aggregated measure is shown as AGG(Measure name) while the initially non-aggregated measure is displayed as SELECTED AGGREGATION TYPE(Measure name).
 It is useful to know that the aggregation type of a pre-aggregated measure cannot be changed in the view. You have to change the formula of this calculated field to change its aggregation type.
 2B) Variable Cost Ratio – at an aggregate level of data (not at Project ID level)
 The default aggregation type Tableau selects when we place a non-aggregate measure in the view is SUM. Hey, what if we change it to AVG (average), why is it still not producing the correct figures?To understand this, we have to check what is happening in the background.
 Clearly, calculating from the row level and then aggregating leads to a false result of 68.0% vs the correct 74.8%. The aggregated variable cost ratio is not a simple average of the Project ID level results but a weighted average where the weights are the Total Cost figures by Project ID. Naturally it does matter whether a 20% variable cost ratio is reached on a Total Cost of 100 or 1.000.000.The respective calculation of the weighted average (as would be seen in Excel) is at the bottom row of the below table, building on the well-know SUMPRODUCT function:
 How can we achieve this in Tableau? We do not find ’weighted average’ in the default aggregation types so we have to compile a formula to express it.
 Wait, we just arrived back to the original, pre-aggregated variable cost ratio formula... Hence having the weighted average in the view, we see that it is identical to pre-aggregated calculated measure.
 Finally, let’s see a summary table of how non-aggregate and aggregate calculated fields work.
