26 August 2016
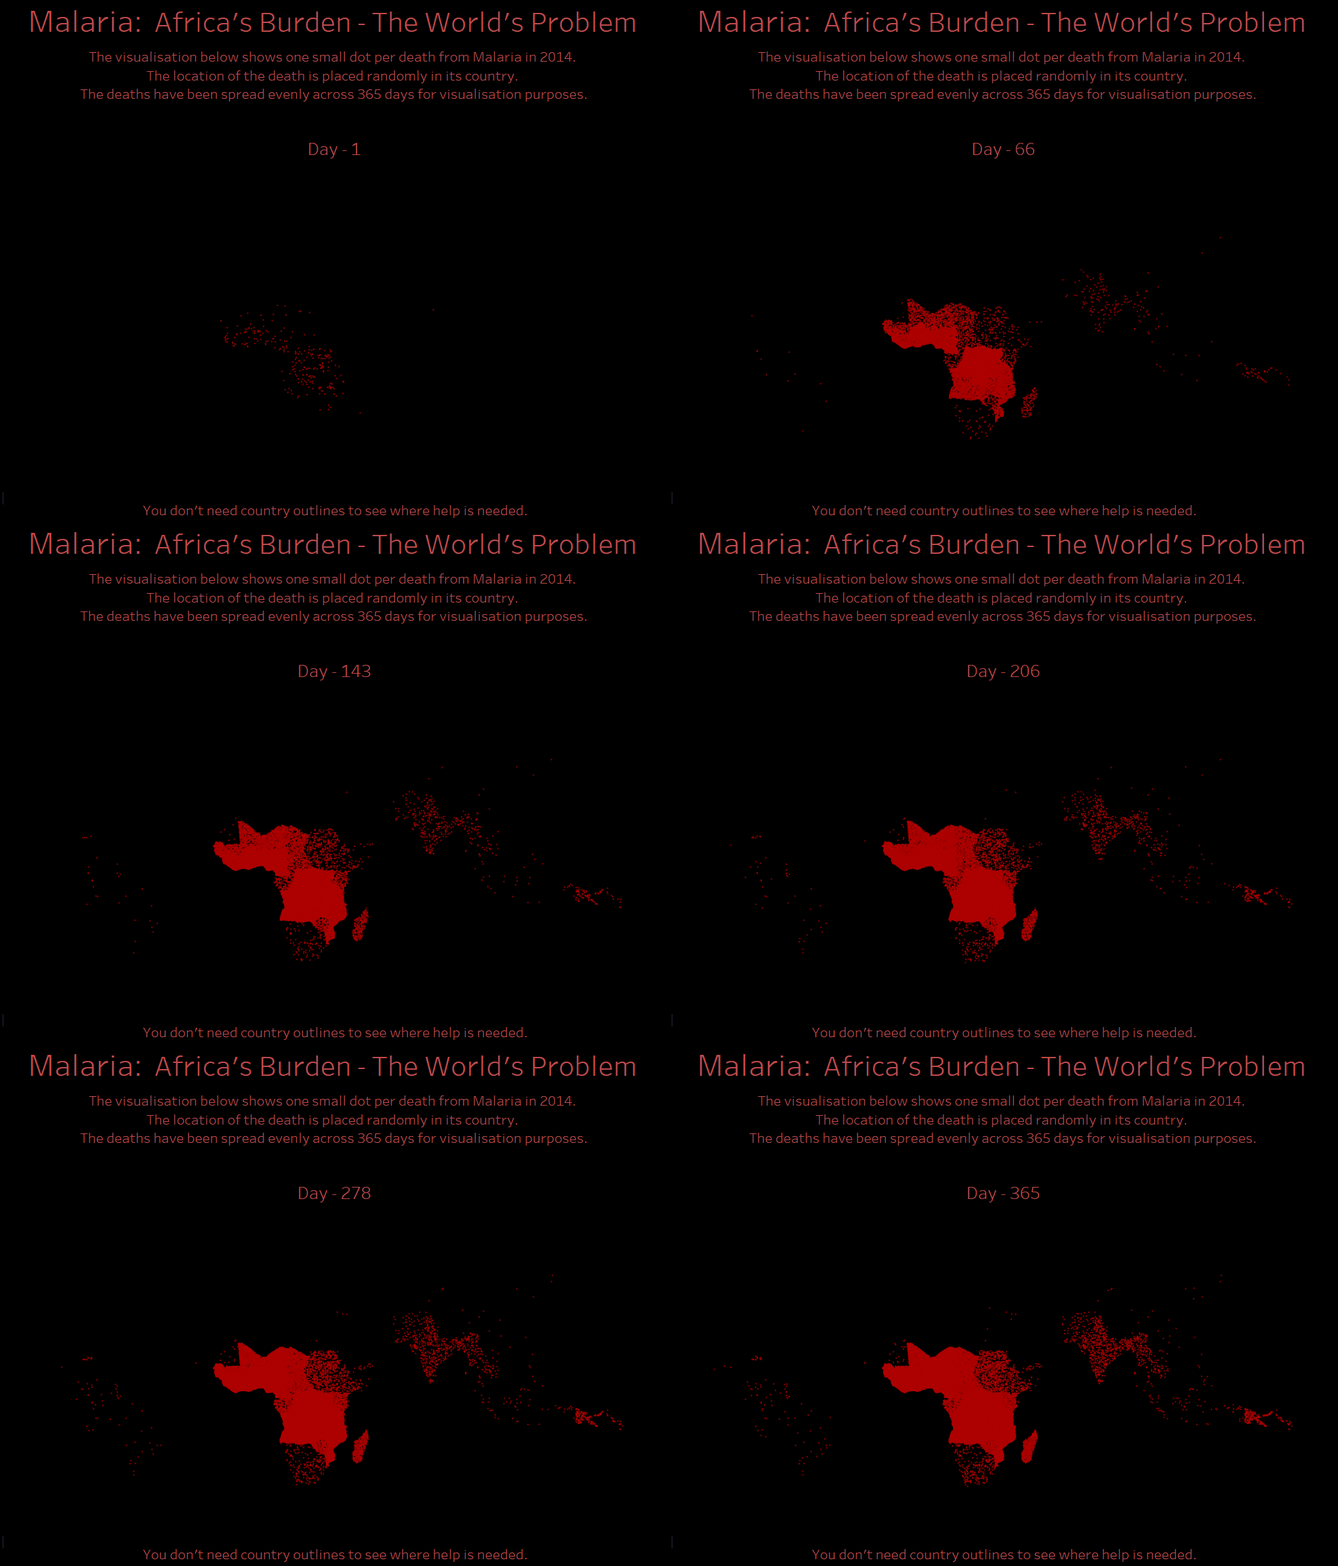
I recently produced the visualisation below for Makeover Monday: The video below explains the concepts behind expanding the data (and creating one point per death) using Alteryx. The key aspects are:
 The video below explains the concepts behind expanding the data (and creating one point per death) using Alteryx. The key aspects are:
- The Generate Rows Tool

This tool will allow you turn one row into many, e.g. in this example I use it to turn a row showing 5 deaths into 5 rows of data.
2. The ST_RandomPoint formula

This formula allows you to randomly assign a point within a polygon. In this case it randomly assigns a point to the 'death'.
Follow along with the video and let me know what visualisation you can produce using the same technique.https://youtu.be/sh_yulpL1qI