


Everyone knows Tableau is an awesome tool to help you see and understand your data with recent innovations in versions 9 and 10 being around the data aspect of that mission. Tableau acknowledges that the data in front of you isn't always clean, or stored in a data warehouse, or even in an easy to analyse format. One of the earlier steps in that direction came in version 7.0 where Tableau introduced the Tableau Data Server as a way to enable an entire organisation to connect to data whether they had the correct drivers installed or even knew where the data was.
Tableau Data Server v2
Today I still love the Data Server. Having a centralised repository of data, always up to date, always fast TDEs is awesome. It's a cornerstone of the 'throw away analysis' I've become used to. After all if you're going to answer questions so fast you don't feel the need to save your work, it needs to be fast and it always needs to work.But the Data Server has always had a key flaw...which dataset do I use? I say it's a flaw with the Data Server, it's not, it's a flaw with humans not naming their datasets in a meaningful way. But that's where a tool become vital isn't it? Stepping in where humans fail or don't perform.So here's my wish for the next 18-24 months of Tableau investment, that same investment that's brought us Tableau Server, LOD calcs and TDEs...
Make Selecting Data Intuitive, Smart or Both!
Up until now the answer to selecting data has been to see the underlying data as a table...but why? In the Tableau world if somebody argues that the best way to analyse data is with a table they will be met with the following response:
Rapid understanding, exploration and communication of data requires a visual representationparaphrased from Stephen Few
So why when it comes to selecting data do we revert back to the classic table of data? There are the obvious reasons, which I'm sure some reading this will be shouting at the screen, and usually centre around the need to have confidence in the underlying data you're about to analyse. But I think this is close to the same argument people tend to make for tables instead of graphs. After all you can't see and understand an entire table of raw data, so can you ever fully trust it?The most common solution I've seen to this issue has been to mash together the table and chart using visual aids to guide the understanding of what's usually a large and 'scroll-bar-tastic' table of data. For instance Trifacta Wrangler visualises the distribution of dimensional values present in the data.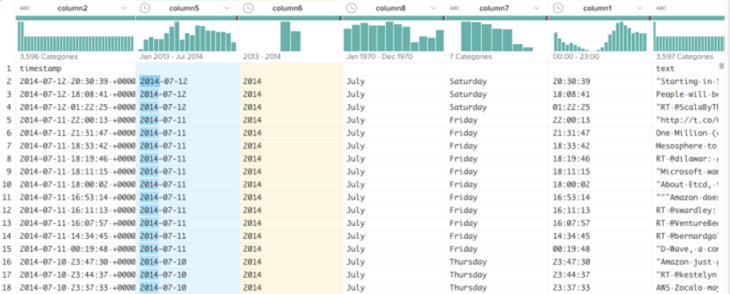 But is this a good representation of how people think when they're selecting data to work with?When I'm analysing data in Tableau I start with a question, for example 'How have sales performed over time?' I double click the sales pill and Tableau responds with the total sales value, followed by a double click of order date and Tableau responds with a line chart showing sales over time. My thoughts and actions were in sync and I loved the experience.
Start with a question
So why can't selecting data also start with a question? Not 'can you guess what your colleague has named that interesting dataset?' but 'What would you like to analyse?'In other words let me select the measures, dimensions and values I'm interested in and do all the work of dataset selection, pivot, filter and union for me.So what does this Data Server 2.0 look like? How could it work? Well let's start with a question: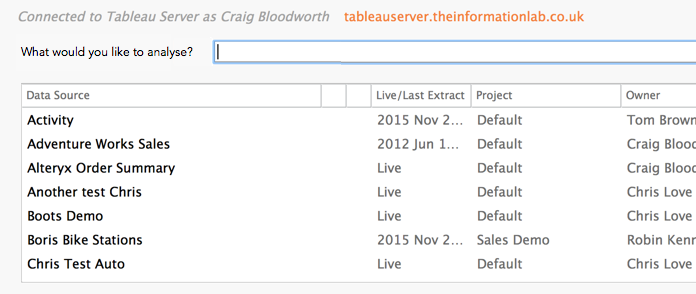 What would you like to analyse?
And I'll respond with the answer: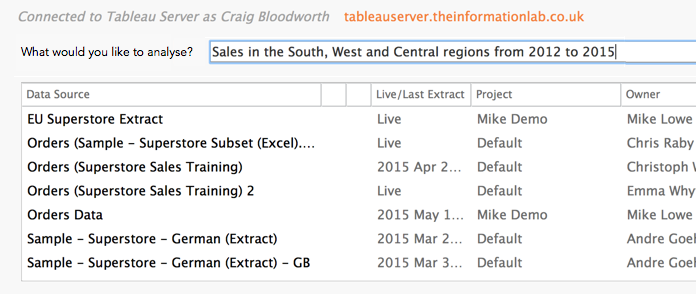 Sales in the South, West and Central regions from 2012 to 2015
Now responding with natural language, or close to natural language may seem a little far fetched, but let's take a look at how the sentence breaks down: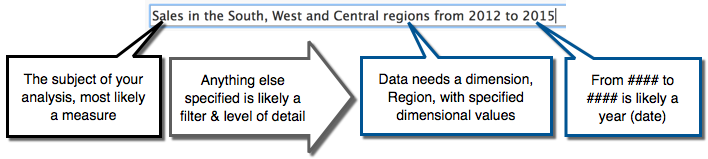 In order to select some data for me does the Tableau Data Server know how to respond to the statement I've made? Sure it does! We've told the Data Server where all our data is, it knows (or could find out) the metadata of each connection. We need our dataset to have columns named 'Sales', 'Region' and 'Date'...easy! In fact the columns don't even need to be named 'Region' or 'Date', we just need a string column to contain the dimensional values 'South', 'West' and 'Central'. Similarly we just need a date/time field with the year range 2012 to 2015. Today all the Data Server is missing is a collection of these dimensional values.
Make it so
So this is my call to action, my Tableau wish for 2016 and beyond. Make data selection & prep not only easy but smart!As for where this idea came from, it's blast from my not so previous past. Between graduating from the University of York and joining The Information Lab, I had the privilege of working at YorkMetrics. Their Inflexsion semantic engine and Termscape applications which have inspired this solution are currently in closed beta trials. Interested? Why not drop them an email to info@yorkmetrics.com.