

7 October 2015
This week NASA's Project Apollo Archive released more than 12,000 photos from manned Apollo missions to Flickr. I thought it would be fun to do something in Tableau with them but the associated data was limited, so rather than a traditional data visualisation I decided to build a photo Mosaic in Tableau. Doing things like this help me learn new Tableau techniques and add a fun dimension to my day job in the evenings. The result is below, click on the link to explore the interactive workbook. Below I'll go into details of how I built it.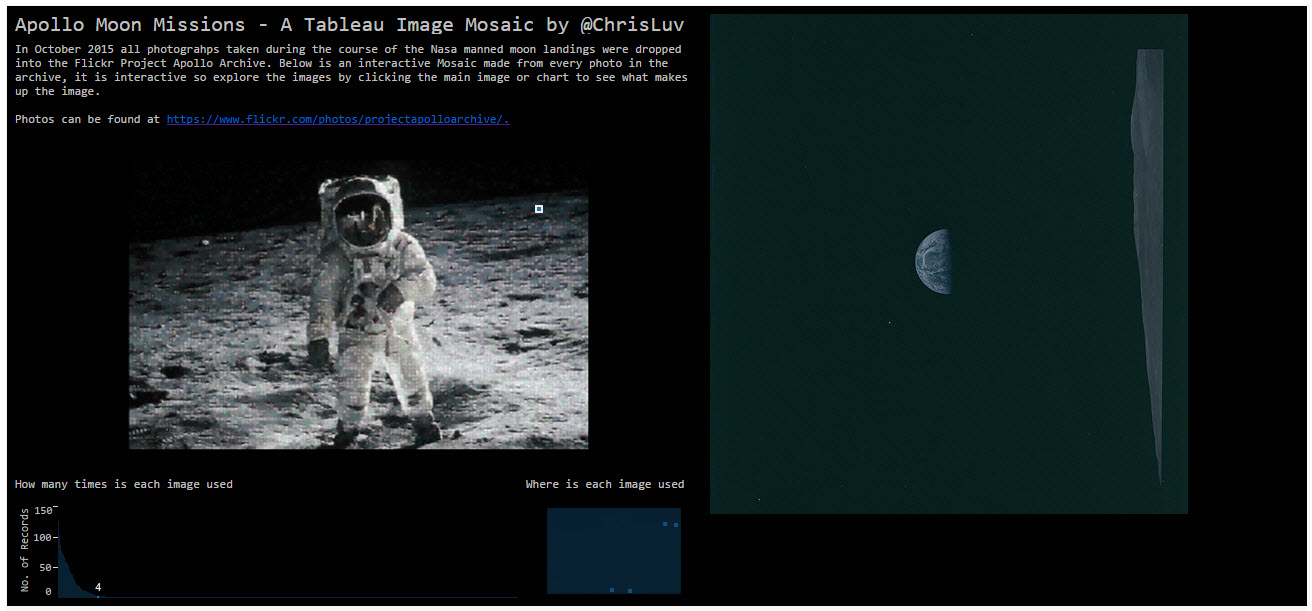
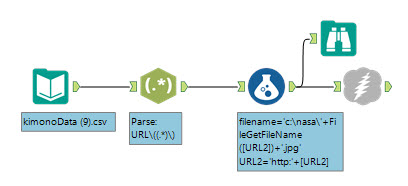 I parsed out the image URL using RegEx and then created a filename, the download tool then let me download from each URL, writing the Image to the file path specified.
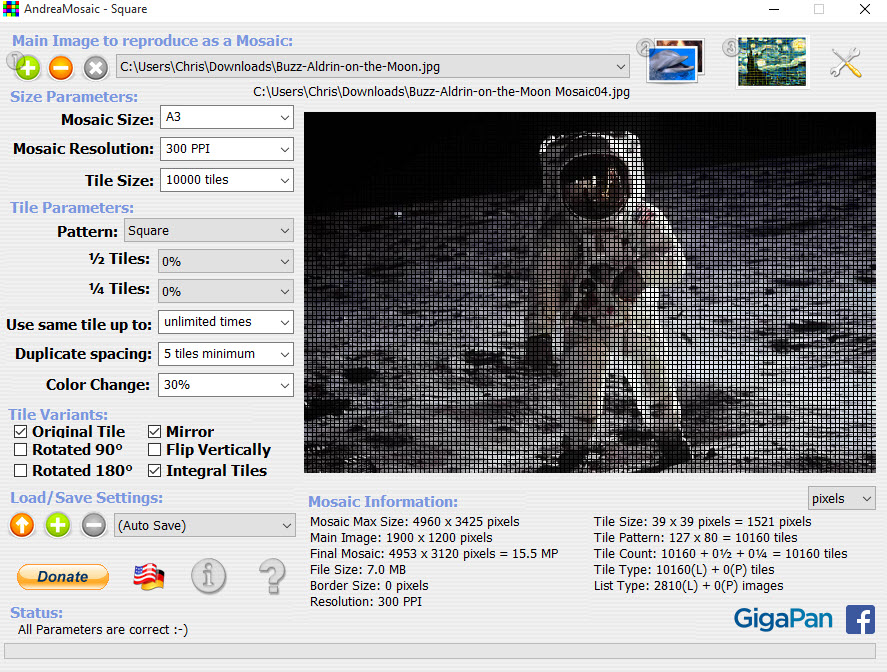 ...the result - click for a more detailed image.
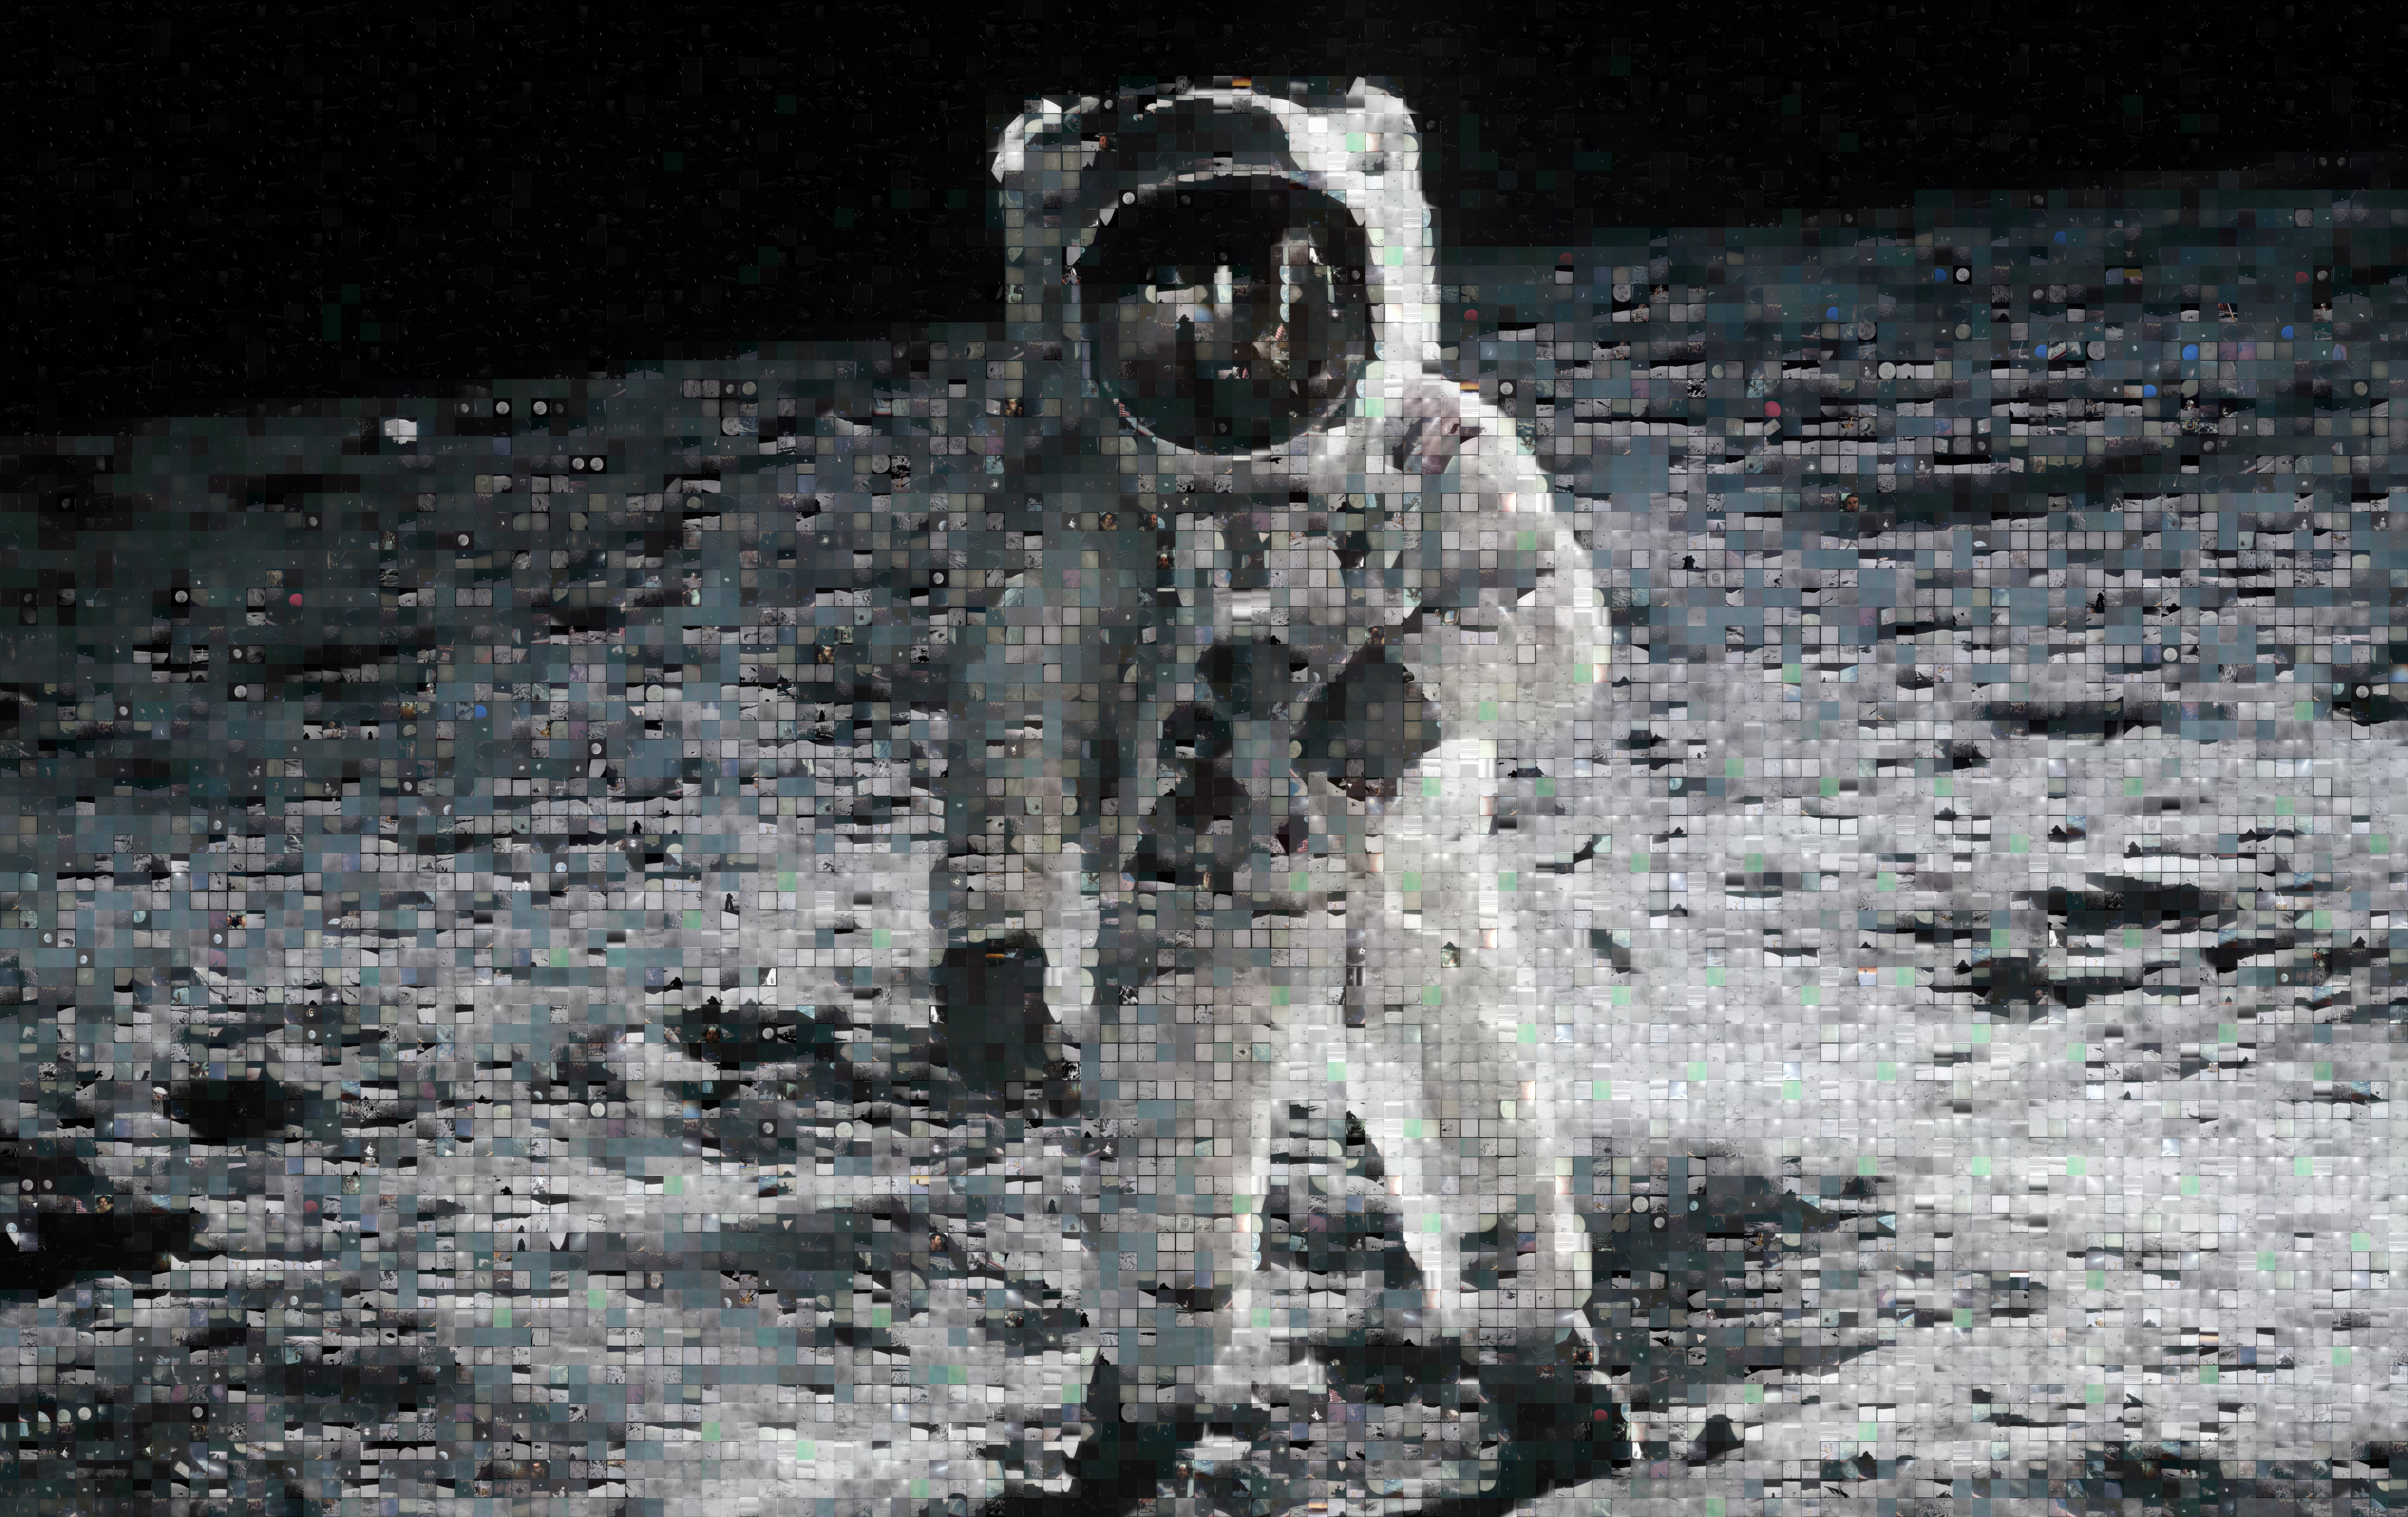 Now how to find which image was used where? A quick look at the setting and I found a Text report option - looks useful....
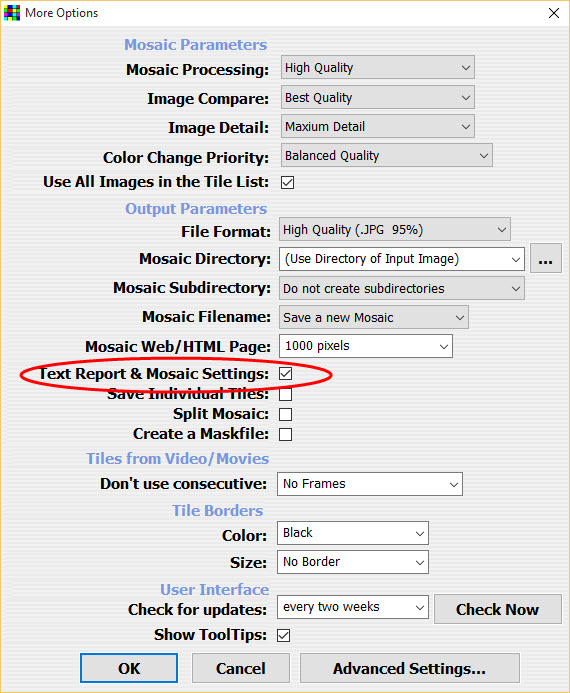 Another Result!
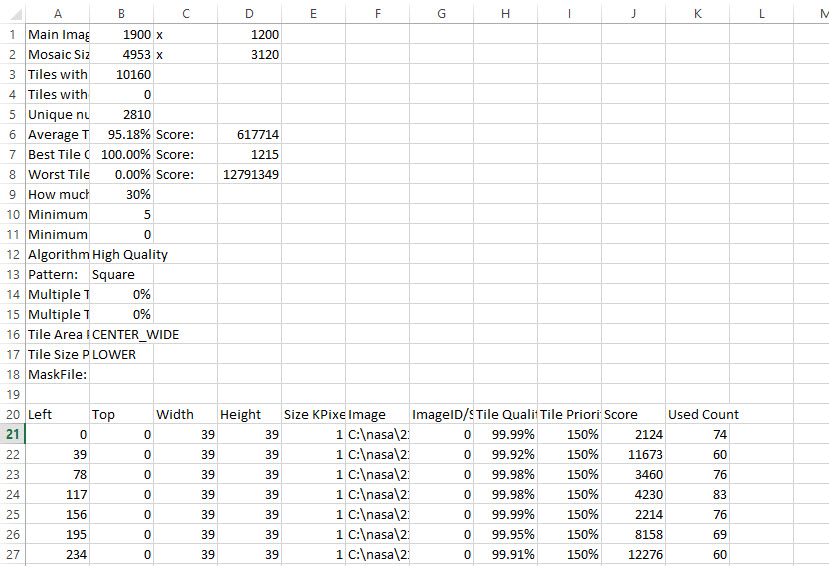
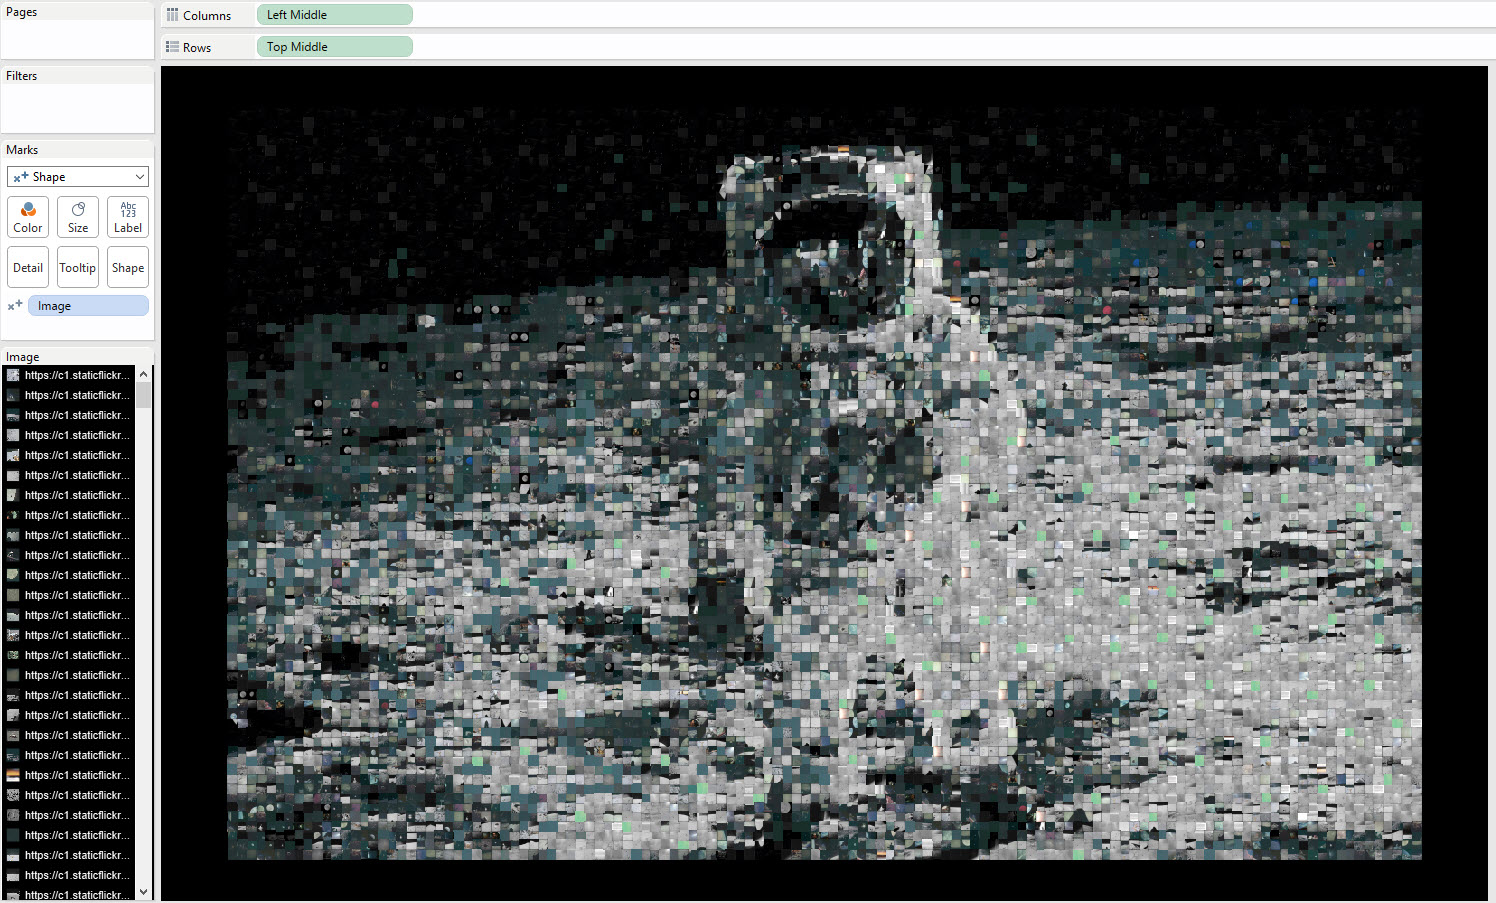 To do this I created two new fields, taking the [Left] pixel from the data and adding on half the [Width] value, doing same for the [Top] and [Height], this put my 'pixels' (shapes) in the centre where Tableau adds the shape. I then dropped my images into the Shapes folder in my repository and used Jewel's fabulous Pokemon trick (I'd tweaked the options in AndreaMosaic to ensure every image was used at least once).The downsides to this approach is that the size of the shapes was hard to get right, it changes as the worksheet changes. Also the image didn't look as good as the original Mosaic in AndreaMosaic. Thirdly it just wouldn't save or upload to Tableau Public - Tableau stores shape images in the .twb XML in a binary format and thus created a 400Mb+ twb file!So I went back to the drawing board....using a Background Image might just work. I then overlaid with Squares on Mark Type (to act as Pixels) and turned down transparency to zero. That's what created the final image and allowed me to then use URL Actions and Highlight Filters with the other charts (one being a smaller version with transparency turned up) to achieve the final result you see above.
1. Web Scraping
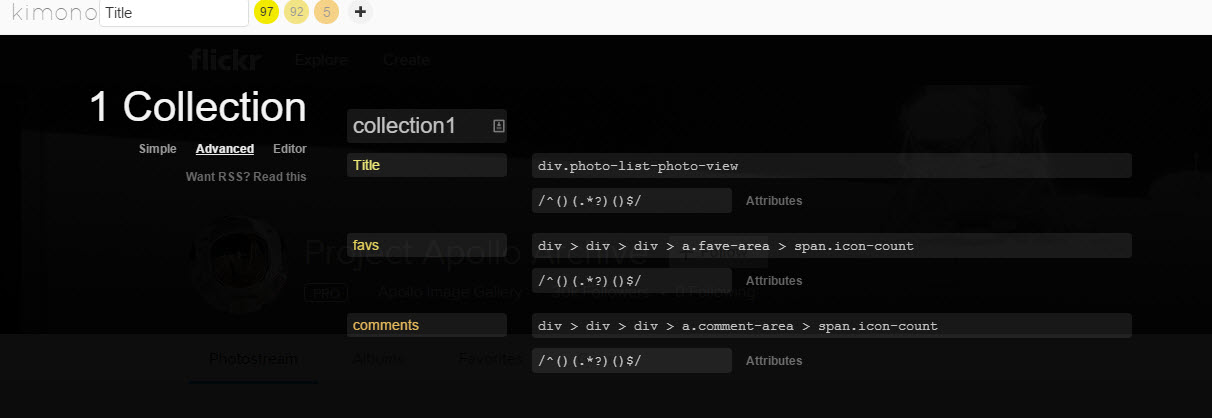
To find the details of each picture my first step was to look at the Flickr API, but it was daunting to be honest; I wanted this to be something I build over the course of a few hours. So I investigated Import IO and Kimono Labs, these are both tools I use for web scraping but in this instance neither really worked that well with Flickr due to the way the pages are rendered. I experimented and found the best option was to use the Photostream page in Kimono, I found a portion of the script that pointed to the thumbnail image and used that. I also wanted to downloaded the number of favourites and comments but sadly that didn't produce any results when I ran the API and so I couldn't add that element to the final Visualisation.Customising the scraping in Advanced Editor in Kimono
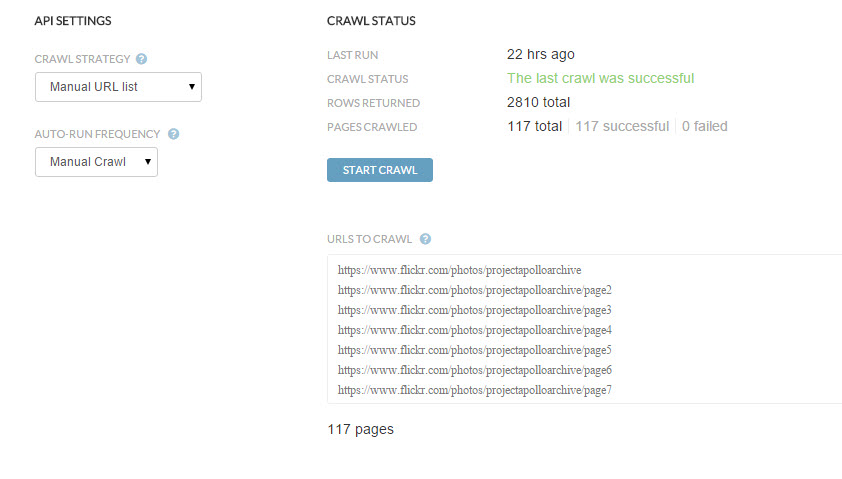
Setting up to scrape several pages
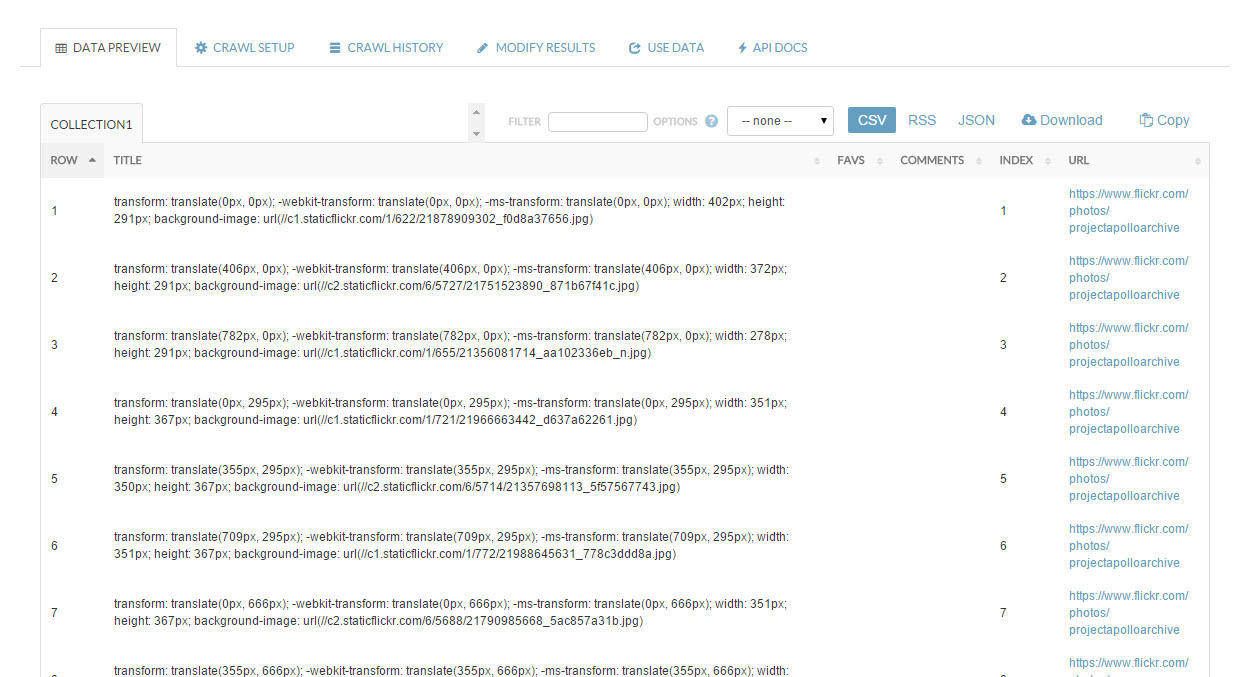
Results
2. Alteryx
This gave me just under 3,000 rows of data, not all the photos but enough for me to create the image. I now wanted to download each photo locally to make the Mosaic. So I turned to Alteryx....I parsed out the image URL using RegEx and then created a filename, the download tool then let me download from each URL, writing the Image to the file path specified.3. AndreaMosaic
I've never created a Mosaic Image before so a quick Google led me to a free piece of Software called AndreaMosaic. Give it a Master Image and a folder of Images to use in the Mosaic and a minute later........the result - click for a more detailed image.Now how to find which image was used where? A quick look at the setting and I found a Text report option - looks useful....Another Result!4. Tableau
Using the data above (row 20 down) in Tableau gave me a dataset I could play with, I used a secondary dataset with the URL and Filepath to assign Primary Aliases back to my primary (a useful tip if you don't want to use blending)My first idea for the Mosaic was to generate the image again in Tableau using Shapes, yes you can use ~3000 shapes in Tableau and yes it does process okay.To do this I created two new fields, taking the [Left] pixel from the data and adding on half the [Width] value, doing same for the [Top] and [Height], this put my 'pixels' (shapes) in the centre where Tableau adds the shape. I then dropped my images into the Shapes folder in my repository and used Jewel's fabulous Pokemon trick (I'd tweaked the options in AndreaMosaic to ensure every image was used at least once).The downsides to this approach is that the size of the shapes was hard to get right, it changes as the worksheet changes. Also the image didn't look as good as the original Mosaic in AndreaMosaic. Thirdly it just wouldn't save or upload to Tableau Public - Tableau stores shape images in the .twb XML in a binary format and thus created a 400Mb+ twb file!So I went back to the drawing board....using a Background Image might just work. I then overlaid with Squares on Mark Type (to act as Pixels) and turned down transparency to zero. That's what created the final image and allowed me to then use URL Actions and Highlight Filters with the other charts (one being a smaller version with transparency turned up) to achieve the final result you see above.