

18 April 2018
All the information in this post is based on the Project Maestro Beta 4 release. Functionality and options available might change when the product is officially released.Probably you have already heard about Tableau Prep (aka Project Maestro), Tableau's new ETL tool that allows us to have a fast and visual overview of our data and to prepare, cleanse and blend it easily to at the end output it to Tableau. There isn't an official release date but in the meantime you can sign up to download the beta and have a play with it.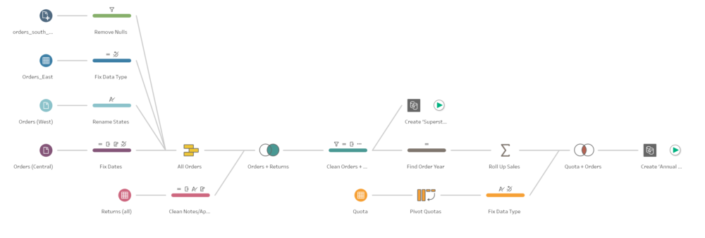 Notice that you can easily track and review the tasks you are applying to edit, remove or review them and have a quick and easy understanding of the data preparation process that is being applied to the different data sets until we create the final output.
 Also, when we connect to a data source, for instance our more than familiar Superstore Sales, we see a very similar environment than on Tableau Desktop. With the same icons for the different data types, calculated fields use the same syntax... you will feel quite familiar with it.
 You can then Add a Step if you want to see an overview of your data and perform filters, create calculated fields, create groups or change aliases, rename fields and other typical data cleanse and data preparation tasks. Add Aggregate to aggregate your data based on the dimensions and measures you wants. Add Pivot to pivot your data as we used to do in Tableau Desktop. Add Join and Add Union to combine one data source with others and Add Output to output our data to save to a file or publish as a data source to Tableau Server or Tableau Online. Each option has also a unique icon so you can identify it easily and you can also rename all of them to have a meaningful title and document your flow.
 Also, in one Step you can perform several actions, like creating several calculated fields, filter some data you don't want to include, rename fields, etc. To reduce length of the flow.
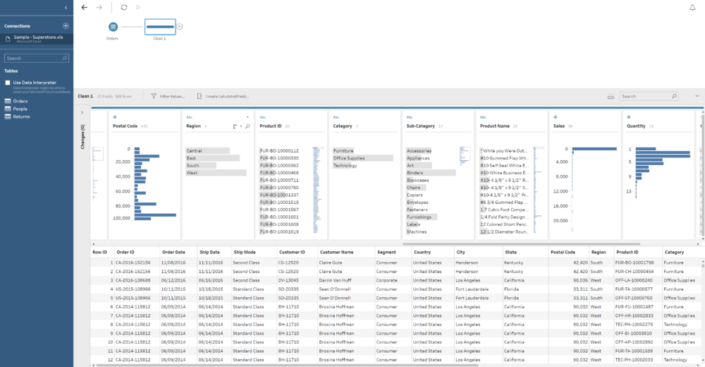 As you can see in the image above, on the bottom part a tabular / row view of your data set and in the middle we have the Profile Pane, showing a resume of each of the fields in our data. You can quickly see next to the name of the field that we have 17 different values in the Sub-Category and around 2,000 for Product ID. Or that West is the region with higher number of rows or that the Quantity is concentrated on values between 2 and 4. It is also important to clarify that we can select the amount of data (rows) we want to use for this profiling. How? If we click on the first step of our flow, the one were we connect to the table, there is a Data Sample tab to select the amount of data to include in the flow: the default for Maestro, a fixed number of rows (both will improve the performance of the flow) or all the data. In case we select a sample, we can also select the sample method. From this window we can also include filters, change field names and types or unselect fields we don't want to use.
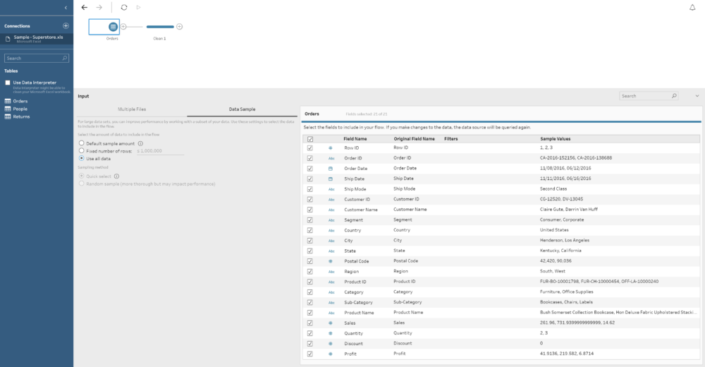
 The other type of steps (Aggregations, Joins, Unions...) have a different set of options that we will review in a next post but all of them have a similar look & feel.
 If we select this final option we will then need to specify our Tableau Server / Online credentials as we do when we publish a dashboard from Tableau Desktop and then select the Site, Project and name of the data source where we want to save it.
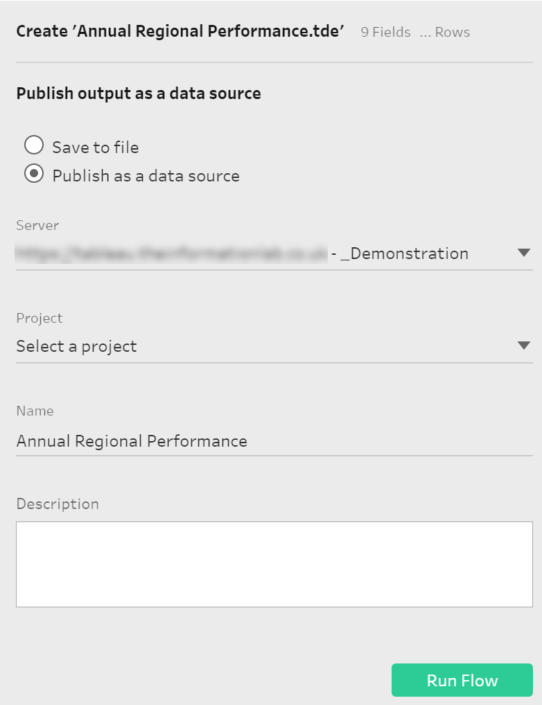
As I said at the beginning, if you want to have a look at it more in detail you can sign up to the Beta and download Maestro already: https://www.tableau.com/project-maestro. I will write some more posts related to Maestro in the future.Update: You can now download Tableau Prep for free here: https://www.tableau.com/products/prep
What is Tableau Prep (aka Project Maestro)?
As I mentioned above, we could describe Tableau Prep as an ETL tool that allows us to prepare and cleanse our data to make sure it is ready before you start your analysis in Tableau Desktop. At the end a lot of times our data needs some preparation before starting with our analysis and visualisations, or maybe we want to combine it with additional data sources before. These tasks can already be done in Tableau Desktop, but sometimes it can become a bit messy the different changes that we apply: with several calculated fields just for data cleansing purposes that makes our data pane a bit messy or different filters that we should apply that aren't as clear for the rest of the analysts, or we join lots of data sources together that slows down our workbooks. Tableau Prep allows us to perform all this tasks that are already available on Tableau Desktop but in a much easier and clean way, making also very easy to replicate and run those steps again in the future and share it with others.How does Tableau Prep work?
As other ETL tools Prep works in a step by step basis where we have to first of all connect to the data set or data sets we want to prepare, then use operations to filter, split, rename, join, summarise, create calculated fields, etc. then check the actions we have applied so far and at the end, output the data to a Tableau Extract or publish it to Tableau Server or Tableau Online. At the end is how a flow (the combination of all those steps) looks like in Maestro. Notice that you can easily track and review the tasks you are applying to edit, remove or review them and have a quick and easy understanding of the data preparation process that is being applied to the different data sets until we create the final output.
How intuitive will it be for Tableau users?
After using the Beta for some days, I can say you will feel quite comfortable with Maestro if you are already a Tableau user. Even the start screen looks very similar to the Tableau Desktop main screen. With the connections options to the left, our recent work in the middle of the screen but now showing our flows instead of dashboards and the right side for resources, training, etc.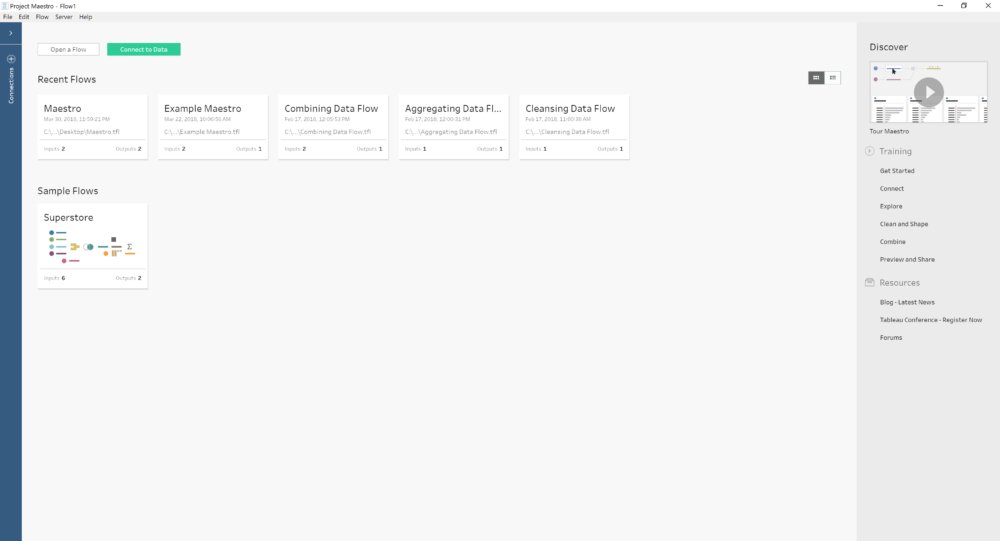 Also, when we connect to a data source, for instance our more than familiar Superstore Sales, we see a very similar environment than on Tableau Desktop. With the same icons for the different data types, calculated fields use the same syntax... you will feel quite familiar with it.
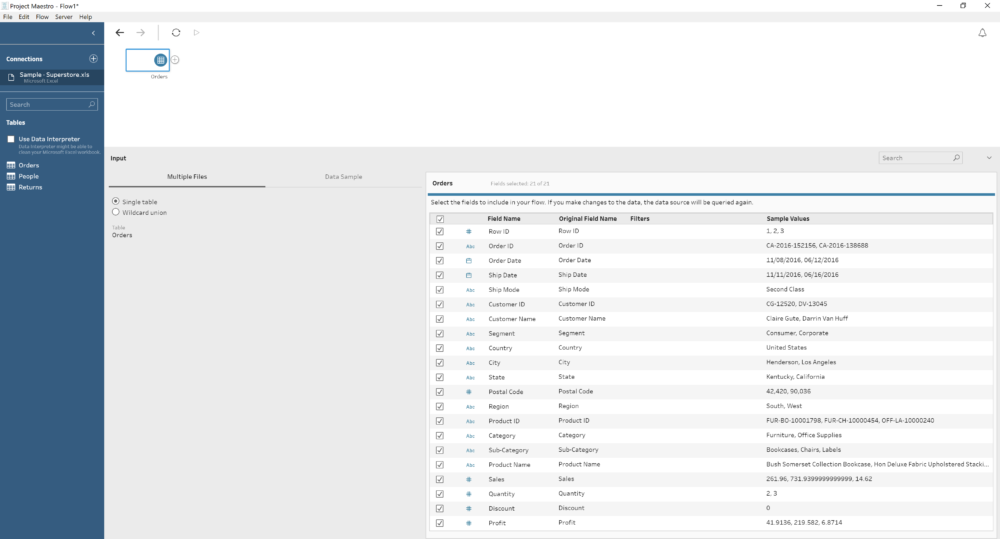
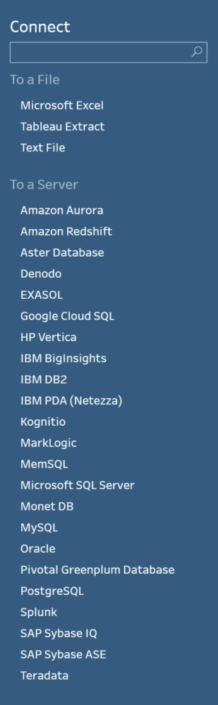
What data I can connect to?
Having in mind that the current version is Beta 4, there is already a good number of data sources we can connect to. From Excel and txt files to Amazon Redshift, Exasol, Microsoft SQL Server, MySQL, Oracle, PostgreSQL, Teradata, Splunk... and Tableau Extracts! Yes, this means you will be able to connect to Extracts located in your computer (at least for now, we will need to wait to see if we can connect to extracts on Tableau Server) and perform tasks and data preparation on TDEs and Hyper extracts. Here's a full list of the available data sources nowadays.
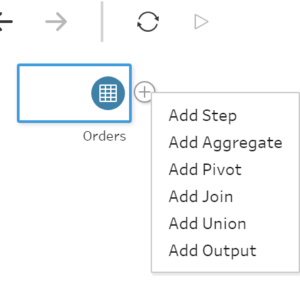
How do I start a flow?
Once you have connected to your data source or data sources, you can just click in the + button next to any of the data sources and then select the task you want to perform.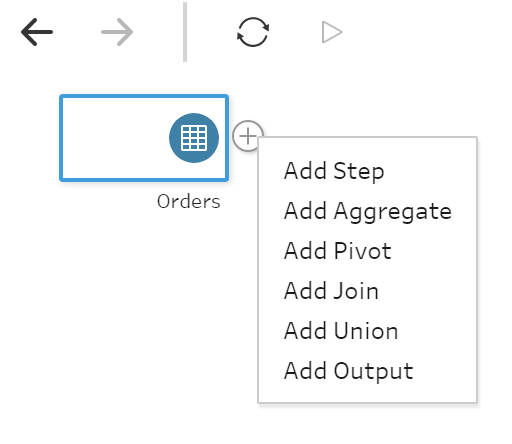 You can then Add a Step if you want to see an overview of your data and perform filters, create calculated fields, create groups or change aliases, rename fields and other typical data cleanse and data preparation tasks. Add Aggregate to aggregate your data based on the dimensions and measures you wants. Add Pivot to pivot your data as we used to do in Tableau Desktop. Add Join and Add Union to combine one data source with others and Add Output to output our data to save to a file or publish as a data source to Tableau Server or Tableau Online. Each option has also a unique icon so you can identify it easily and you can also rename all of them to have a meaningful title and document your flow.
 Also, in one Step you can perform several actions, like creating several calculated fields, filter some data you don't want to include, rename fields, etc. To reduce length of the flow.
What information displays when we add a step?
Probably one of the things I like most about Maestro is the overall overview of each data field that it shows you when you add a step to the flow. This is how it looks like: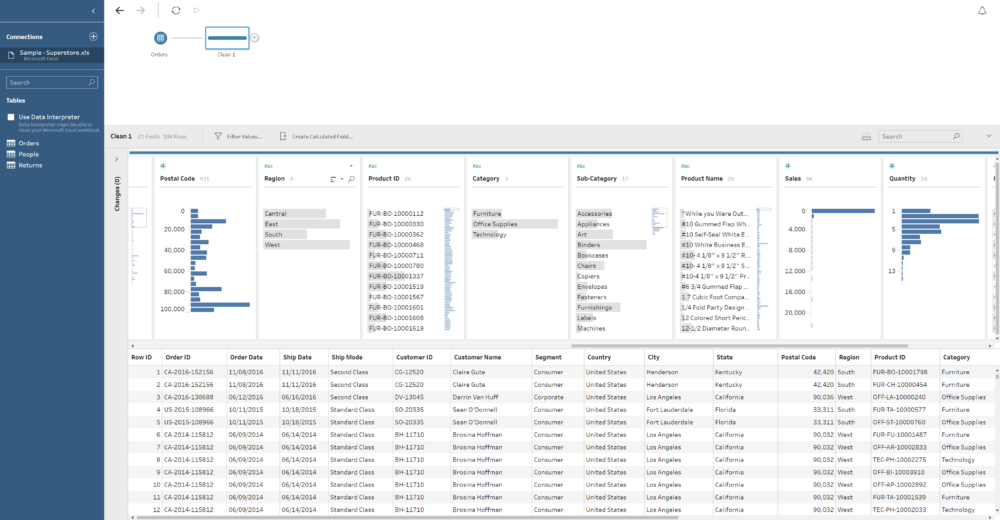 As you can see in the image above, on the bottom part a tabular / row view of your data set and in the middle we have the Profile Pane, showing a resume of each of the fields in our data. You can quickly see next to the name of the field that we have 17 different values in the Sub-Category and around 2,000 for Product ID. Or that West is the region with higher number of rows or that the Quantity is concentrated on values between 2 and 4. It is also important to clarify that we can select the amount of data (rows) we want to use for this profiling. How? If we click on the first step of our flow, the one were we connect to the table, there is a Data Sample tab to select the amount of data to include in the flow: the default for Maestro, a fixed number of rows (both will improve the performance of the flow) or all the data. In case we select a sample, we can also select the sample method. From this window we can also include filters, change field names and types or unselect fields we don't want to use.
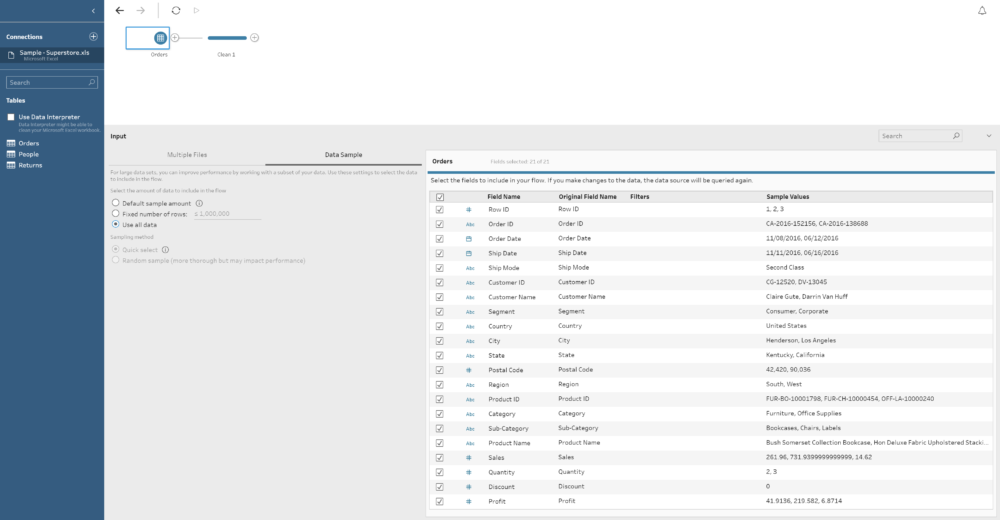
How can I track my changes?
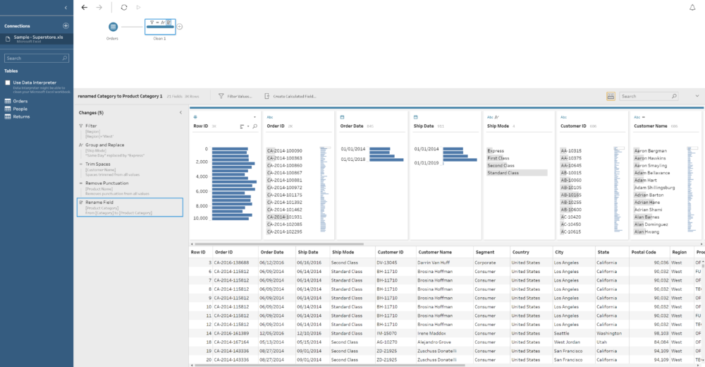
If we are performing more than one task in a single step we can click on the Changes option on the left corner of the data profiling window and a tab will expand to show all the different changes we have applied already in the current step in order to review, remove, sort or edit them if we need.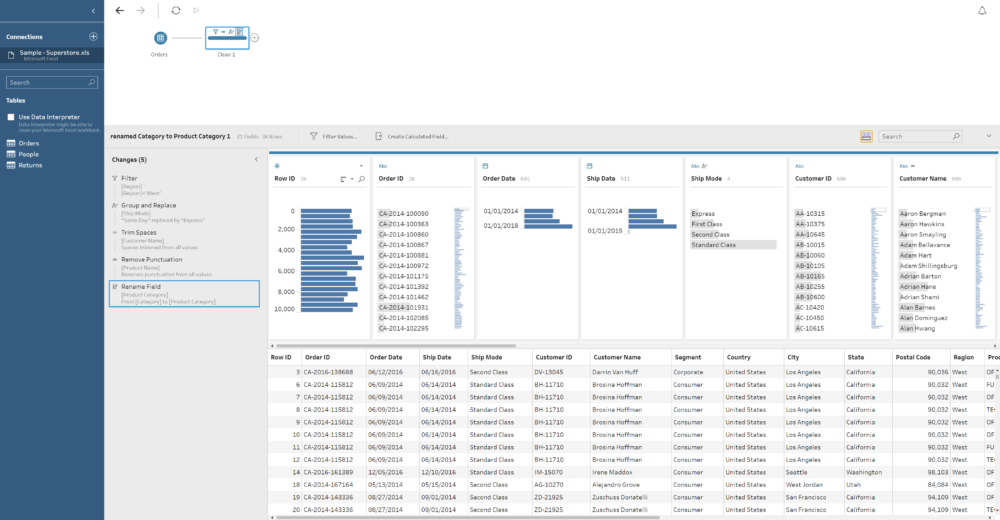 The other type of steps (Aggregations, Joins, Unions...) have a different set of options that we will review in a next post but all of them have a similar look & feel.
Refresh the data and run the flow
On the top of the screen we have also two important options: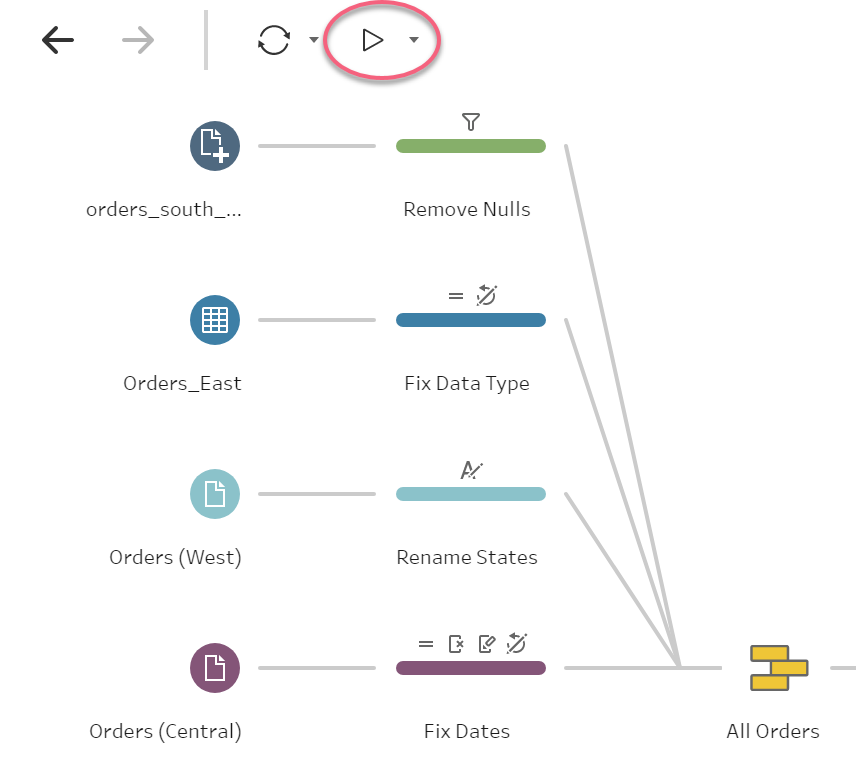
- Refresh the data: This will basically read again the tables / data sources we are connecting as we can do on Tableau Desktop to refresh data sources.
- Run the flow: click here to run the steps of the flow we have created. If we already have an output step, it will create our output or overwrite it if we run it before already.
Outputs available
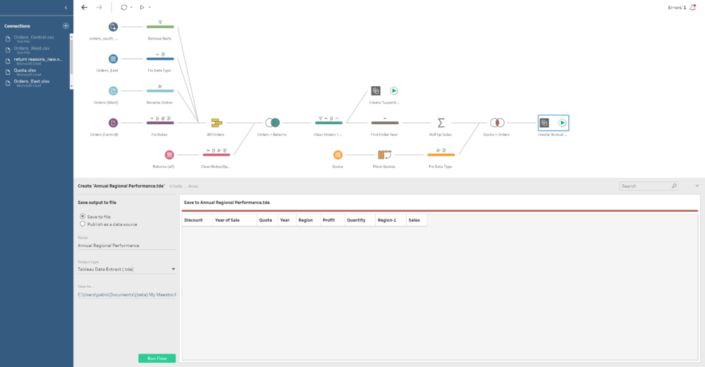
At the end we can add a final Output step where we can specify to save our data to a concrete file and location in our hard drive or we can publish it as a data source. If we select this final option we will then need to specify our Tableau Server / Online credentials as we do when we publish a dashboard from Tableau Desktop and then select the Site, Project and name of the data source where we want to save it.
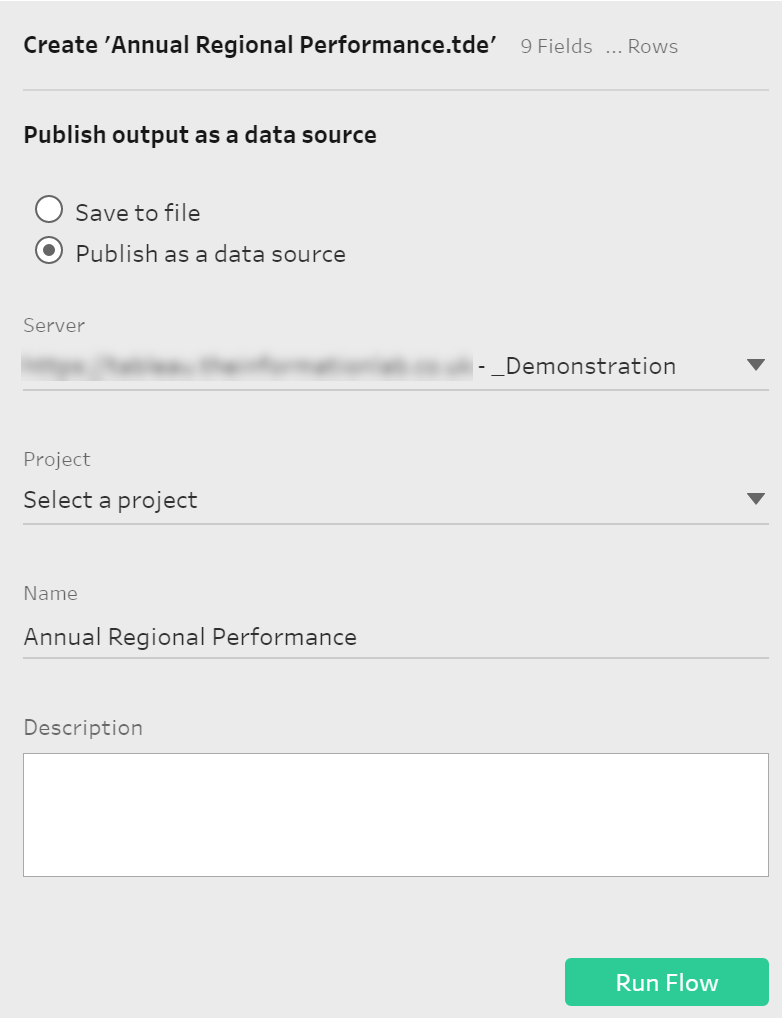
Saving our Tableau Flows
Of course we can also save our flows to share them with other people or to use them in the future if our data changes or it's updated. Just click on File > Save As and select the location you want to save it to and give it the name you want. As you will see there are two new file types you should start to be familiar with:- .tfl: Tableau Flow File Format.
- .tflx: Packaged Tableau Flow File. This will package your local files with your flow to share it with others. Have in mind that only local files can be packaged with a flow. Data from database connections will not be included.