

5 May 2017
Do you know Kaggle and their awesome competitions?If the answer is yes you probably understand what I am talking about, if the answer is no, you should check it out and find tons of dataset about many topics.Few months ago, coach Andy asked me to teach predictive analytics at DS5. Usually because people are new with the topic I cover clustering and linear regression, but this time I also wanted to come up with something new and exciting.I picked this one: Two sigma connect, rental listing inquiries.In this competition, you will predict how popular an apartment rental listing is based on some variables like number of bedrooms/bathrooms, price, etc.The data comes from renthop.com, an apartment listing website. These apartments are in New York City.The target variable, ‘interest_level’, is defined by the number of inquiries a listing has in the duration that the listing was live on the site. In other words, an apartment can be classified as low, medium or large interest.Data fields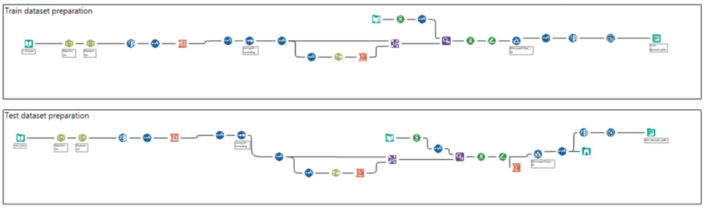 You can download the data preparation workbook here.If you not familiar with spatial analytics in Alteryx you can watch some video from Information Lab at this channel or read some of the blogs available on the website.Now let’s run our models!
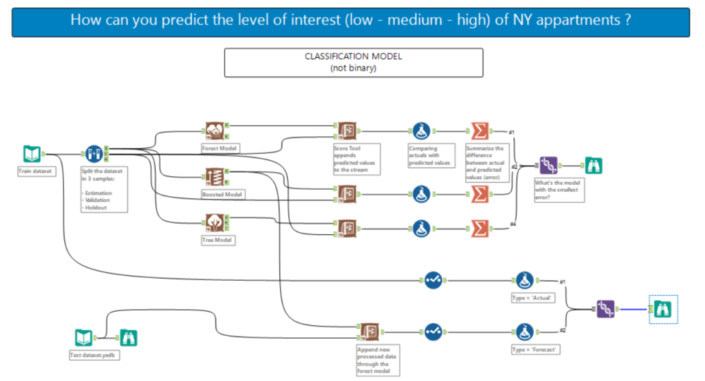 You can find the workflow here.First, a sample must be created with the sample tool as you want to train the predictive models on a subset of data (estimation sample) and validate the models on another subset (validation sample). Anything not categorized in these two gets to the Holdout sample.Just to remind what we are doing here: in supervised learning, we have a data set called training set with the low/medium/high responses that constitute the variable of interest and the other variables that are the predictors or independent variables that explain the dependent one. From this dataset, I want to learn how to predict the low/medium/high variable based on some characteristics (predictors). So, in simple English, if a flat is quite central (short miles’ distance from time square), reasonable price, 2 bedrooms it might be of high interests for families that travel to NY with children, or another flat in Brooklyn with a doorman could be awesome for young people that take cheap flights and arrive in the evening and still can get the key from the doorman.What I want to say here that a mix of predictors explain the variable of interest and we need to teach that to the algorithm to predict a good percentage in the new dataset. Again, we will not predict low/medium/high but a percentage for all three, which the total will add to 100%.I also want to highlight that this is a classification problem with a not binary variable (binary means 0 or 1, YES or NO) as we are spreading the % among three variables.What models are we comparing?Decision tree, Boosted model and Forest model: class of machine learning methods that predict a target variable using one or more variables that are expected to have an influence on the target variable.How to test goodness of prediction?We attached the predicted values at the stream (validation sample from the sample tool) with the score tool:
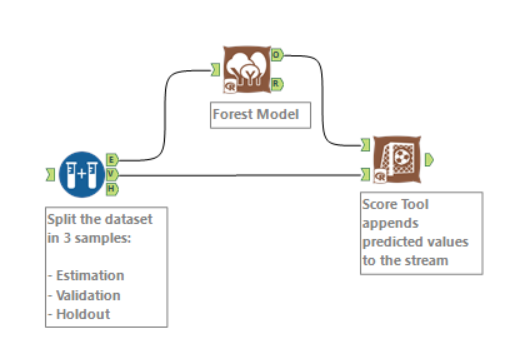 We will have something like this:
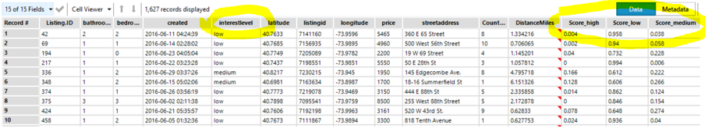 For each listing, we have the actual variable of interest (first row, listingID 42, interest level = Low) and a % for each of the possibilities, if you add that numbers will be = 1.Which is the best model? Well as we already have the answer (we know that listingID 42 has a low interest) so I first create a new column with the following calculation:if [Score_low] < [Score_medium] then (If [Score_medium] < [Score_high] then 'high' else 'medium' endif) else(if [Score_low] < [Score_high] then 'high' else 'low' endif)endifand a second calculation:if [interestlevel] = [label] then 1 else 0 endifOn the first calculation, I create a new column which will be labeled as low/medium/high based on the highest score (in listingID 42, the % of low is the highest, therefore the new column is equal to 'low').The second calculation is 1 if the actual interest level is the same as the predicted one (the level with the highest score) else 0.Now I can use a summarize tool and sum all the 1, the model with the highest number is the best one.
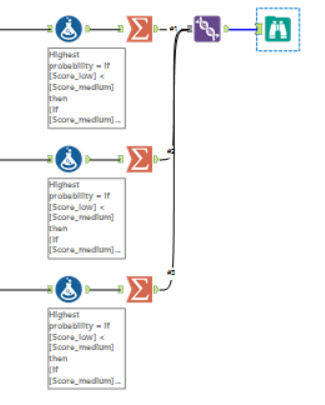
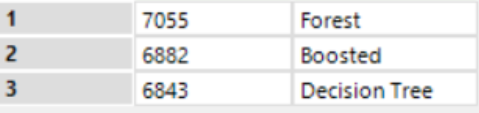 The forest model is the best, it's able to catch 7055 correct answers.Now I can use this model with the new data and predict my variable of interest.Let's have a look at the results:
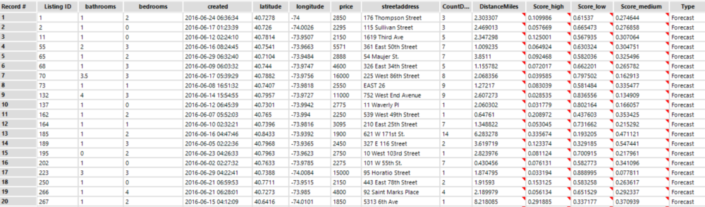 Now if you are a map lover, have fun in Tableau!You can find the workbook here.Enjoy
- bathrooms: number of bathrooms
- bedrooms: number of bathrooms
- features: a list of features about this apartment
- latitude
- longitude
- price: in USD
- interest_level: this is the target variable. It has 3 categories: 'high', 'medium', 'low'
- other variables
You can download the data preparation workbook here.If you not familiar with spatial analytics in Alteryx you can watch some video from Information Lab at this channel or read some of the blogs available on the website.Now let’s run our models!You can find the workflow here.First, a sample must be created with the sample tool as you want to train the predictive models on a subset of data (estimation sample) and validate the models on another subset (validation sample). Anything not categorized in these two gets to the Holdout sample.Just to remind what we are doing here: in supervised learning, we have a data set called training set with the low/medium/high responses that constitute the variable of interest and the other variables that are the predictors or independent variables that explain the dependent one. From this dataset, I want to learn how to predict the low/medium/high variable based on some characteristics (predictors). So, in simple English, if a flat is quite central (short miles’ distance from time square), reasonable price, 2 bedrooms it might be of high interests for families that travel to NY with children, or another flat in Brooklyn with a doorman could be awesome for young people that take cheap flights and arrive in the evening and still can get the key from the doorman.What I want to say here that a mix of predictors explain the variable of interest and we need to teach that to the algorithm to predict a good percentage in the new dataset. Again, we will not predict low/medium/high but a percentage for all three, which the total will add to 100%.I also want to highlight that this is a classification problem with a not binary variable (binary means 0 or 1, YES or NO) as we are spreading the % among three variables.What models are we comparing?Decision tree, Boosted model and Forest model: class of machine learning methods that predict a target variable using one or more variables that are expected to have an influence on the target variable.How to test goodness of prediction?We attached the predicted values at the stream (validation sample from the sample tool) with the score tool:We will have something like this:For each listing, we have the actual variable of interest (first row, listingID 42, interest level = Low) and a % for each of the possibilities, if you add that numbers will be = 1.Which is the best model? Well as we already have the answer (we know that listingID 42 has a low interest) so I first create a new column with the following calculation:if [Score_low] < [Score_medium] then (If [Score_medium] < [Score_high] then 'high' else 'medium' endif) else(if [Score_low] < [Score_high] then 'high' else 'low' endif)endifand a second calculation:if [interestlevel] = [label] then 1 else 0 endifOn the first calculation, I create a new column which will be labeled as low/medium/high based on the highest score (in listingID 42, the % of low is the highest, therefore the new column is equal to 'low').The second calculation is 1 if the actual interest level is the same as the predicted one (the level with the highest score) else 0.Now I can use a summarize tool and sum all the 1, the model with the highest number is the best one. The forest model is the best, it's able to catch 7055 correct answers.Now I can use this model with the new data and predict my variable of interest.Let's have a look at the results:Now if you are a map lover, have fun in Tableau!You can find the workbook here.Enjoy