

11 December 2017
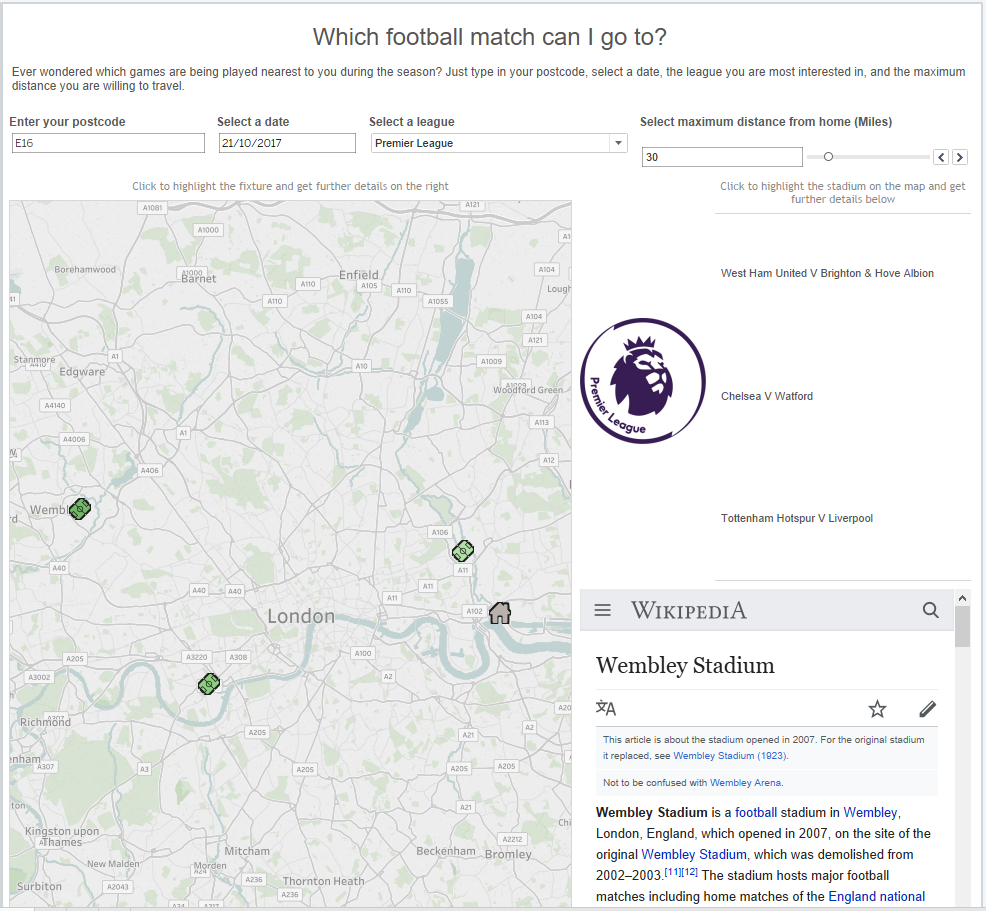
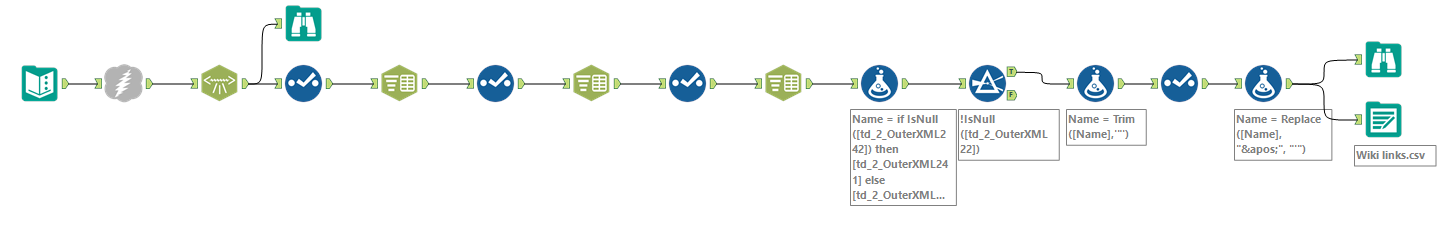
I wanted to create a visualisation to allow me and others to see which English football league games are taking place closest to my house on a given date so I can decide which one I want to see. To do this, I needed a few different datasources from many different places and in many different formats. It is possible to do this directly in Tableau but I used Alteryx to download and prepare my data beforehand.DatasourcesAll the fixtures for the English leagues - http://dedicatedexcel.com/uk-football-fixtures-2017-18-in-excel-format/UK Postcode-outcodes - https://www.freemaptools.com/download-uk-postcode-lat-lng.htmStadium Details - https://www.doogal.co.uk/FootballStadiums.phpWiki Links - https://en.wikipedia.org/wiki/List_of_football_stadiums_in_EnglandI used Alteryx to scrape the data from Wikipedia and then parse out the detail that I needed. This utilises the download tool to scrape data from a particular url.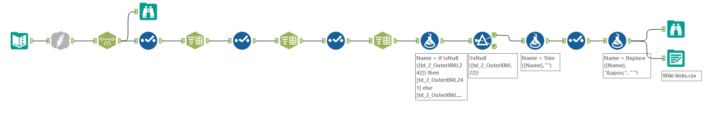 Taking the 4 datasources, I created an Alteryx workflow which calculated the distance from each outcode to each stadium for each round of fixtures. I have used outcode, the first half of the UK postcode, to keep the data small, as using every individual postcode would create a datasource too large for Tableau Public.
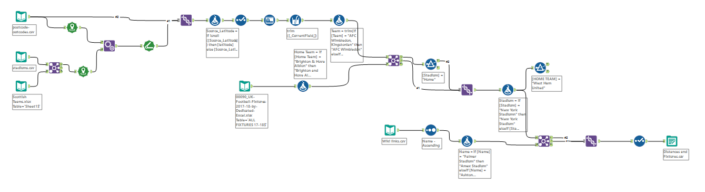 Step 1
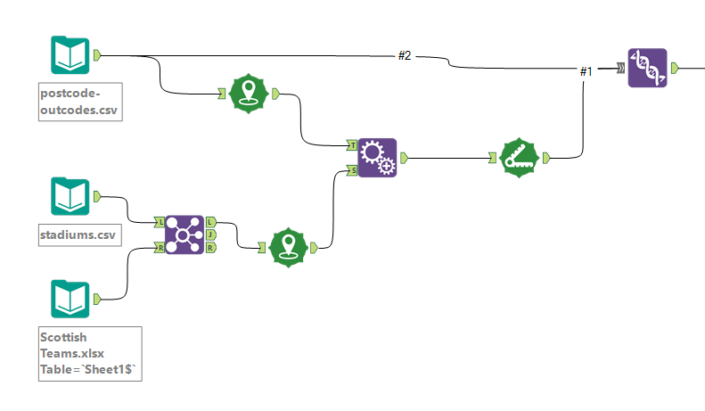 I joined a list of Scottish teams to the stadium data to remove them from the data, as I am only looking at the English league fixtures. Using the “Create Points” tool, I took the latitude and longitudes from both the postcodes data and the stadiums data and created a spatial point. Using the “Append Tool” I appended each stadium to every outcode and then used the “Distance” tool to work out the distance between the outcode spatial point and the stadium spatial point in miles. I then union this back together with the original outcode data so that I have a point for each “home” location.The remaining workflow is joining the football fixtures and the wiki links into the data, cleaning up and preparing the data for analysis in Tableau.
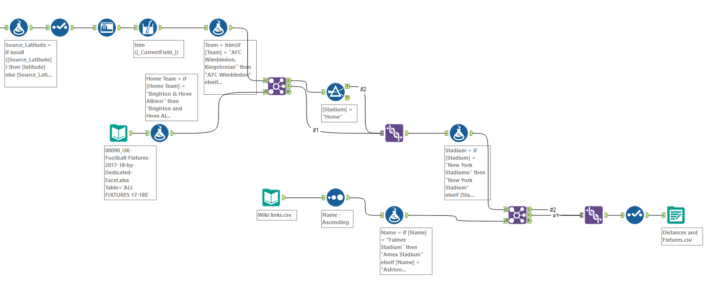 Once in Tableau I created a map using the latitude and longitude values in the data. I created a calculation to use as the shapes on the map. This gives me two different shapes, “Home” will show the location of the outcode that the user inputs, “Stadium” will show all the possible game locations. I placed this field onto shape on the marks card and used custom shapes in the visualisation. Follow these details to add custom shapes - https://www.tableau.com/drive/custom-shapes
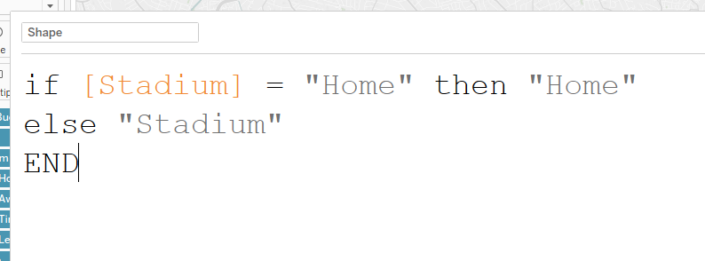 I created 4 parameters to allow my users to input 4 different values.Postcode Parameter
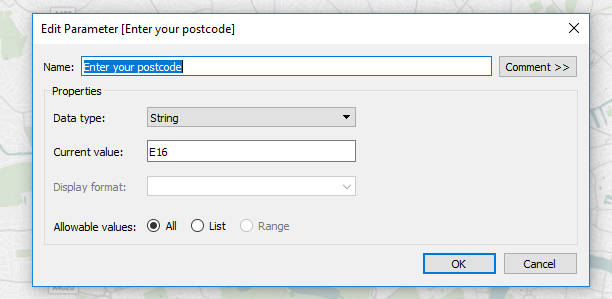 This is a wildcard parameter so that the user can input whatever text they want. This is then used in a calculation to create a filter. This takes the inputted value and compares it to the outcode value in the data.
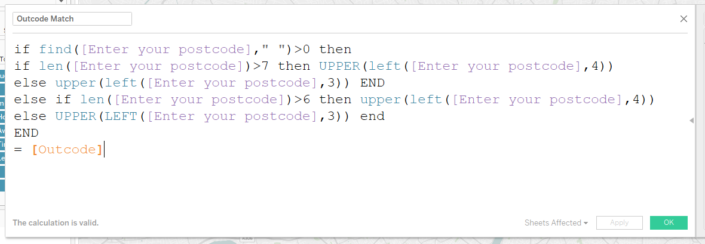 Date ParameterThis is a straightforward date parameter which allows the user to pick an individual date they want to look at.
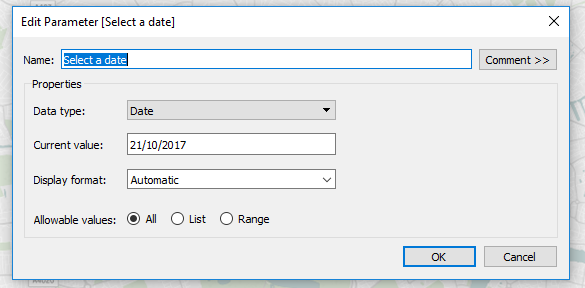 League ParameterA string parameter with 4 possible selections. Notice the value is different to the display as value.
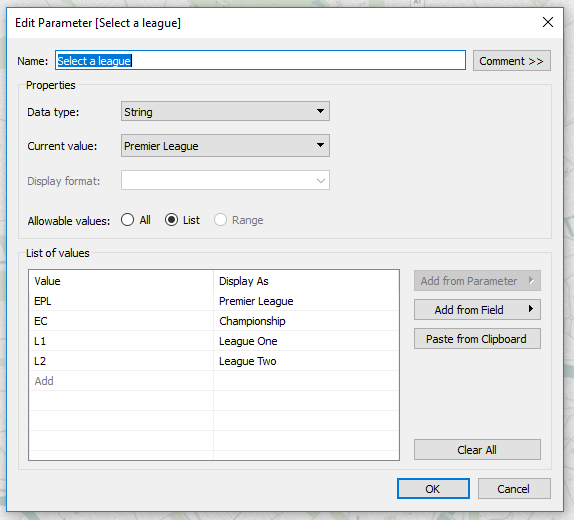 DistanceA range integer parameter that allows the user to select a mile value between 0 and 200 miles in 5 mile intervals.
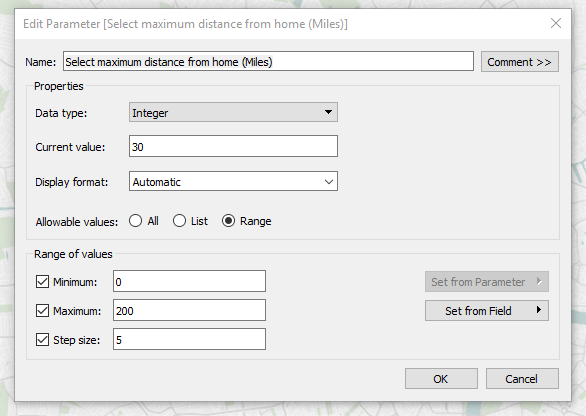 This is used in a calculation to create a filter which will show all fixtures that are closer to the user’s postcode than the selected value away.
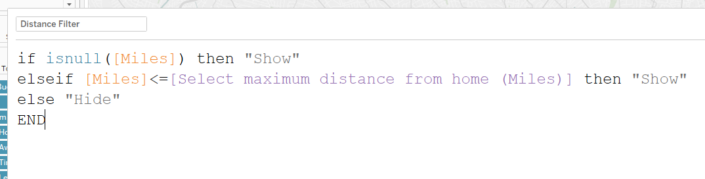 These filters are applied to all worksheets.
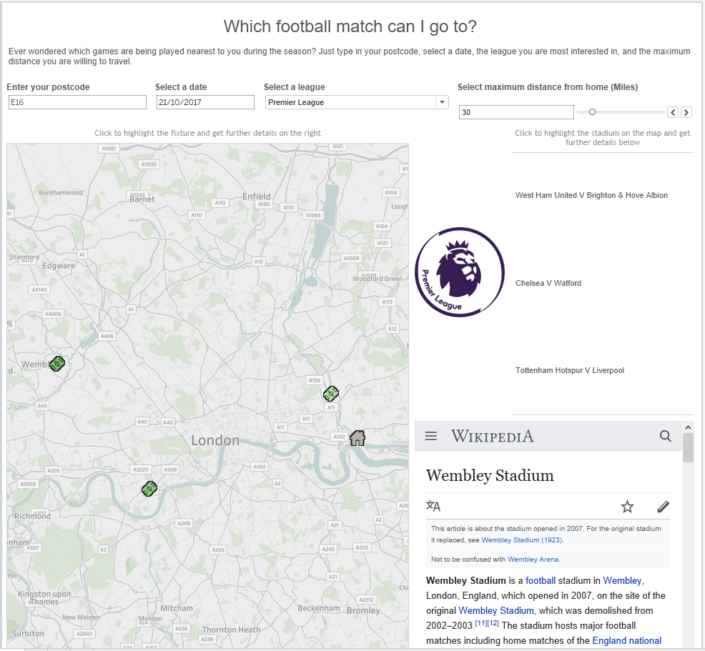 The final element was to use the Wikipedia links, a dashboard URL action and a web page object to allow the user to get some more information on the stadium in the bottom right hand corner of the dashboard. The URL action is set up like this –
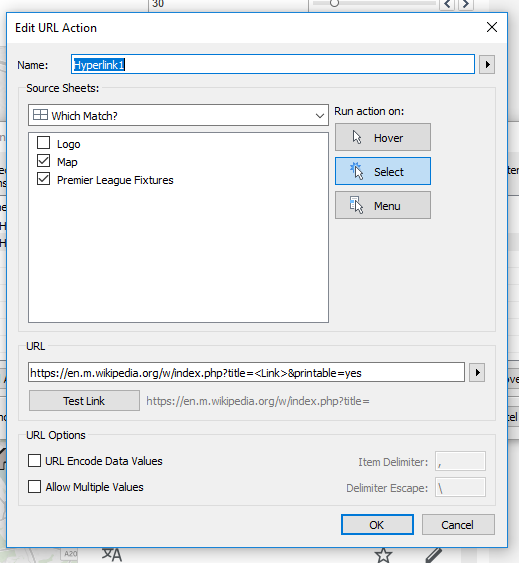 The final dashboard is on tableau public - https://public.tableau.com/profile/andrew.pick#!/vizhome/WhichMatch/WhichMatch
 Taking the 4 datasources, I created an Alteryx workflow which calculated the distance from each outcode to each stadium for each round of fixtures. I have used outcode, the first half of the UK postcode, to keep the data small, as using every individual postcode would create a datasource too large for Tableau Public.
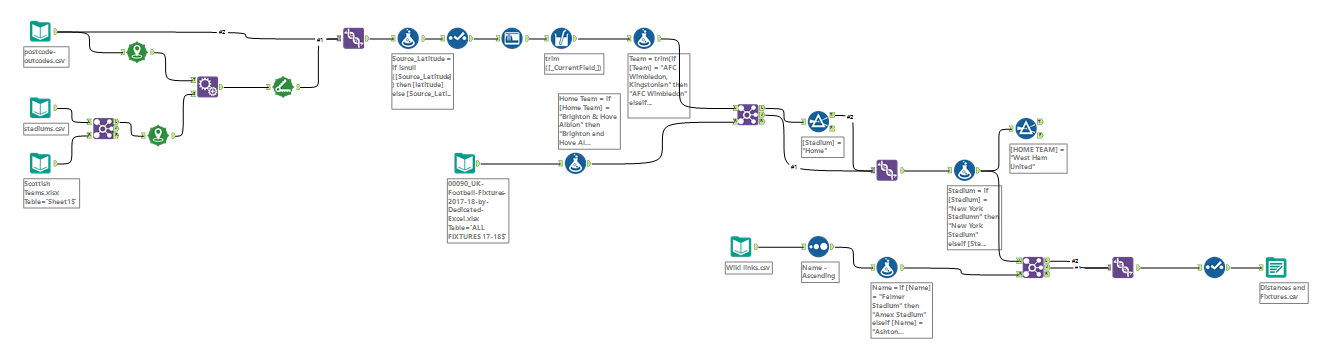 Step 1I joined a list of Scottish teams to the stadium data to remove them from the data, as I am only looking at the English league fixtures. Using the “Create Points” tool, I took the latitude and longitudes from both the postcodes data and the stadiums data and created a spatial point. Using the “Append Tool” I appended each stadium to every outcode and then used the “Distance” tool to work out the distance between the outcode spatial point and the stadium spatial point in miles. I then union this back together with the original outcode data so that I have a point for each “home” location.The remaining workflow is joining the football fixtures and the wiki links into the data, cleaning up and preparing the data for analysis in Tableau.
 Once in Tableau I created a map using the latitude and longitude values in the data. I created a calculation to use as the shapes on the map. This gives me two different shapes, “Home” will show the location of the outcode that the user inputs, “Stadium” will show all the possible game locations. I placed this field onto shape on the marks card and used custom shapes in the visualisation. Follow these details to add custom shapes - https://www.tableau.com/drive/custom-shapesI created 4 parameters to allow my users to input 4 different values.Postcode ParameterThis is a wildcard parameter so that the user can input whatever text they want. This is then used in a calculation to create a filter. This takes the inputted value and compares it to the outcode value in the data.Date ParameterThis is a straightforward date parameter which allows the user to pick an individual date they want to look at.League ParameterA string parameter with 4 possible selections. Notice the value is different to the display as value.DistanceA range integer parameter that allows the user to select a mile value between 0 and 200 miles in 5 mile intervals.This is used in a calculation to create a filter which will show all fixtures that are closer to the user’s postcode than the selected value away.These filters are applied to all worksheets.The final element was to use the Wikipedia links, a dashboard URL action and a web page object to allow the user to get some more information on the stadium in the bottom right hand corner of the dashboard. The URL action is set up like this –The final dashboard is on tableau public - https://public.tableau.com/profile/andrew.pick#!/vizhome/WhichMatch/WhichMatch