

22 January 2015
Ways of learning TableauTableau is a very well documented software which makes it easy to learn this anyway user friendly tool. There are a vast variety of videos and articles available on various aspects of Tableau and a simple google search will also deliver relevant results. Sources like Tableau's knowledge base, Tableau's online help, quick start guides, blogs like ours among other sources provide descriptions of proven methods, how-to tutorials, all readily available documentations. Another way of learning is to create dashboards from scratch. That gives practical experience but you may be somewhat limited by the solutions you already know if the dashboard brief is not challenging. You may visit Tableau Community pages to learn from the topics or even help others during which you also learn. And of course, there is...... reverse engineeringIt involves taking a Tableau workbook created by someone else and methodically working backwards from the big picture into the details, understanding the internal logic of the workbook until you are able to replicate it from scratch. While this route is harder and holds some frustration, it is very effectively teaching Tableau. Of course reverse engineering requires a basic knowledge of Tableau thus it is most beneficial if you are already familiar with the basics and have accumulated some hands-on Tableau experience. Reverse engineering workbooks is in fact the most demanding way to learn - even harder than building dashboards from scratch where you are limited by what you already know.If it is only for learning purposes then treat reverse engineering as a playful exploration, an investigation where you are Sherlock Holmes. It is like finding out a magician. You have to reveal the tricks of the workbook creator. A general advice is to ’click everywhere’. If something gets broken in a view, you can always use the back button or close the file without saving the changes and then reopen it. Before you start, save a new copy for yourself which you can freely change while having the original already filed.Reverse engineering is typically relevant in two cases: either learning (e.g. you have seen something in a viz and want to understand how it is done) or you are trying to fix a workbook (your colleague may have created it, something is not working and you want to correct it). Below we will deal with the first case, where a beginner or intermediate level user intends to learn more 'Tableau'.Where do we find workbooks to reverse engineer? Tableau Public is a rich home of visualisations built on complex Tableau functionalities. All the workbooks published there can be downloaded.Let’s see the steps to analyse a workbook. The below list and the order of steps is subjective. It reflects how I approach an unknown workbook. We will visit a list of questions that serve as guideline through the reverse engineering process.1. Understand the general messageWalk through the dashboards, check the messages, insights. What do the titles tell? Play with the functionalities, what can you filter for, what actions are available? How are the views connected? At this point you do not yet have to go beyond presentation view or even leave the dashboards to go to worksheets.After this step you will understand the purpose of the visualisations and the functionalities purely from a user perspective.2. Check the workbook's structureHow many dashboards does it contain? Are there worksheets not presented on any dashboard? Are there hidden worksheets? Remember, hidden worksheets do not appear when viewing the sheets via the workspace control.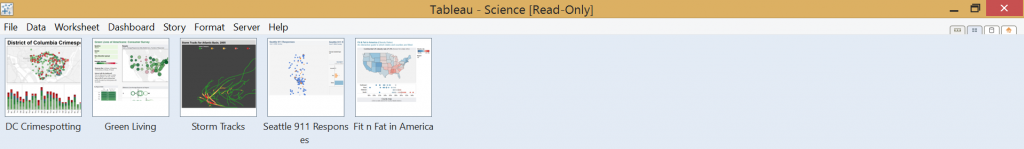 Now you are familiar with the span of the workbook, meaning whether you have to walk through one or five dashboards, etc. I explain the following steps as if we had a single dashboard workbook. Everything is repetitive in case of multiple dashboards.3. Explore the layout and mechanics of the dashboardWhere are the worksheets located on the dashboard? How many of them? Tiled or floating? What actions are available, how are the different views (worksheets) connected on the dashboard? How many views do each quickfilter affect? Are there worksheets hidden until we select a mark somewhere else?The 'Dashboard' window on the left lists the worksheets displayed on the dashboard (denoted by a little checkmark on the worksheet icon) as well as the worksheets not applied but unhidden in the workbook. Should you not see this part of the window, make sure the Window/Show Side Bar menu option is checked.
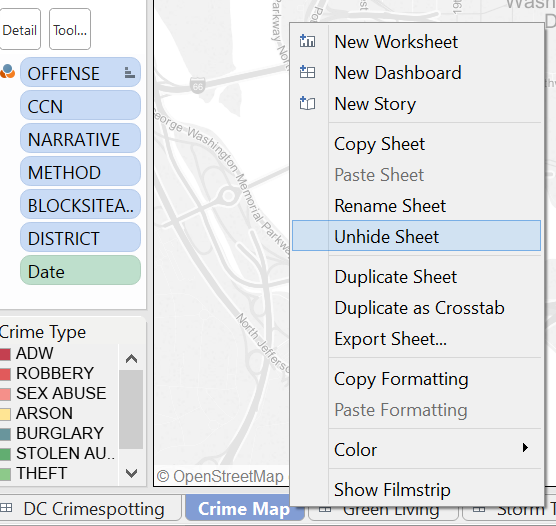
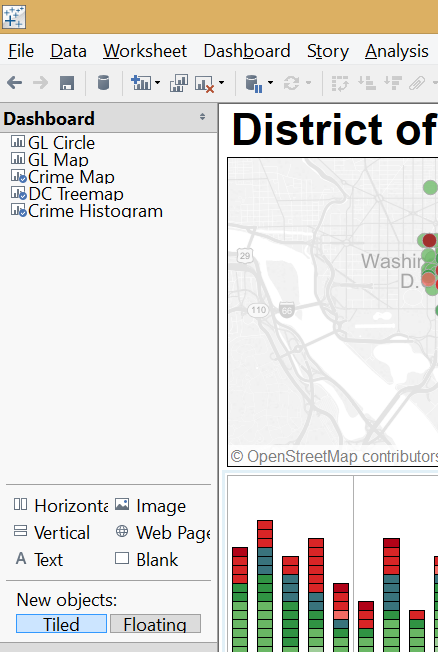 What if the workbook tells a Story? The logic is the same, on the left hand side of the window you will find a 'Dashboards and Worksheets' panel from where you can navigate to any item.The next step goes into the details, to the essence of reverse engineering. Repeat this analysis for all worksheets.4. Break down the views to their smallest building blocksGo to the worksheet from the dashboard it is displayed on. If necessary, unhide the worksheet. The examples are taken from the Science workbook, shipped with Tableau Desktop.
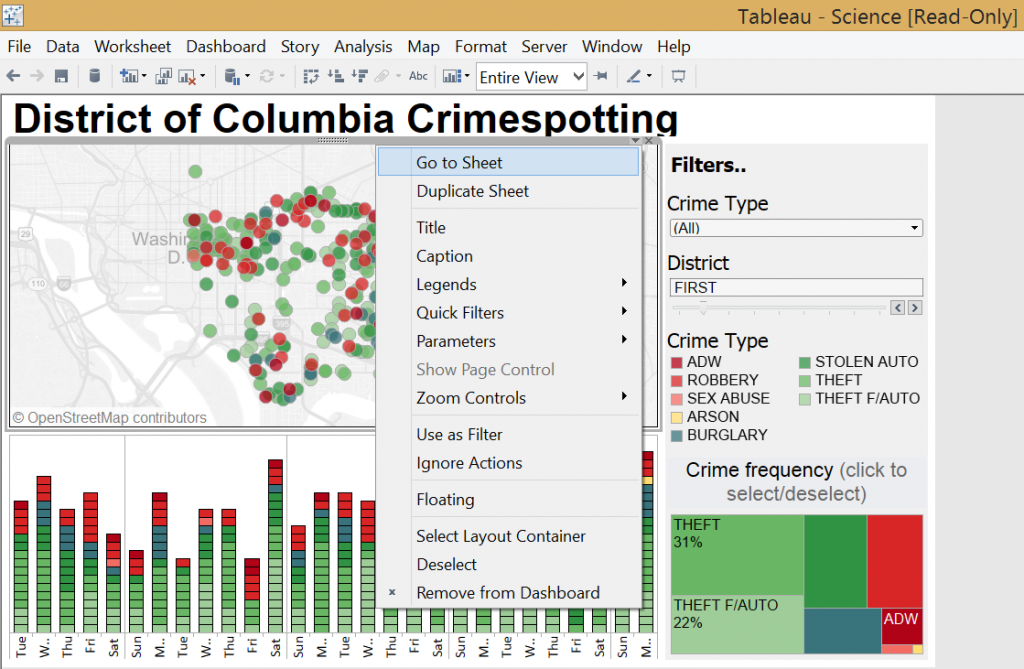
 - What data sources are used to create the view? Is it built of only one data source or the primary data source was blended with a secondary one (look for the orange colour denoting a secondary data source in the Data Window and a measure/dimension in the view, taken from the secondary data source). Expore the data connection Properties and also view the data to see the structure, the fields.
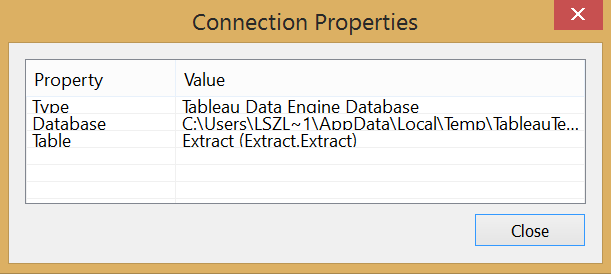
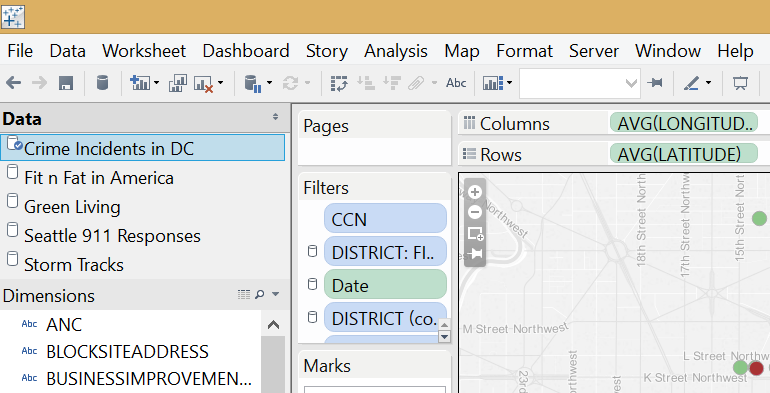 Data connection properties:
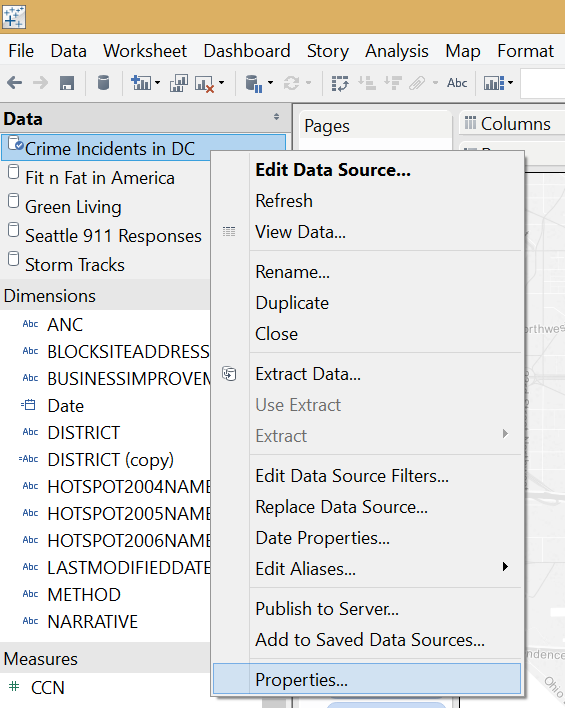
 Viewing data:
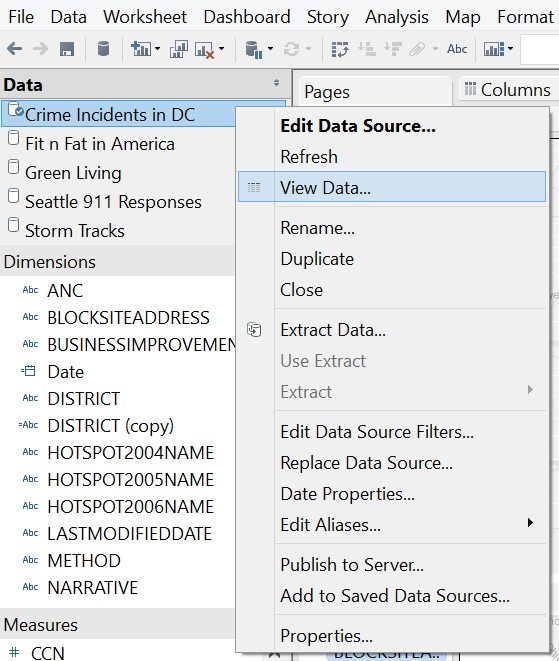
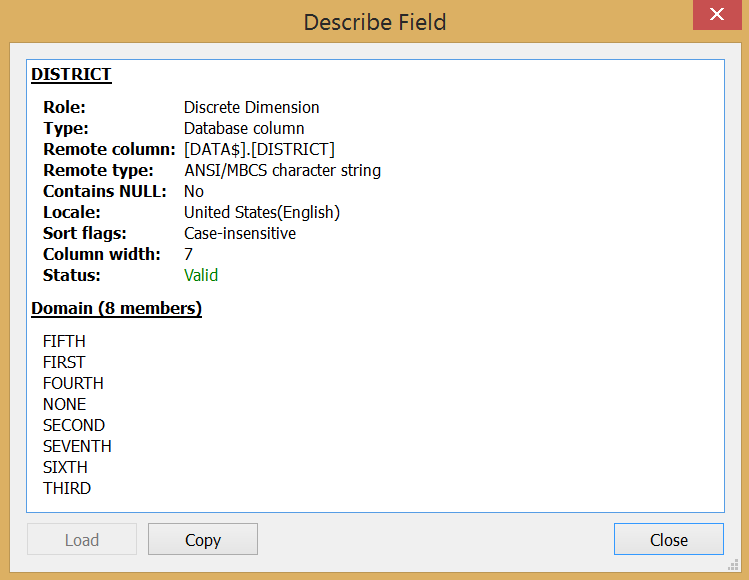
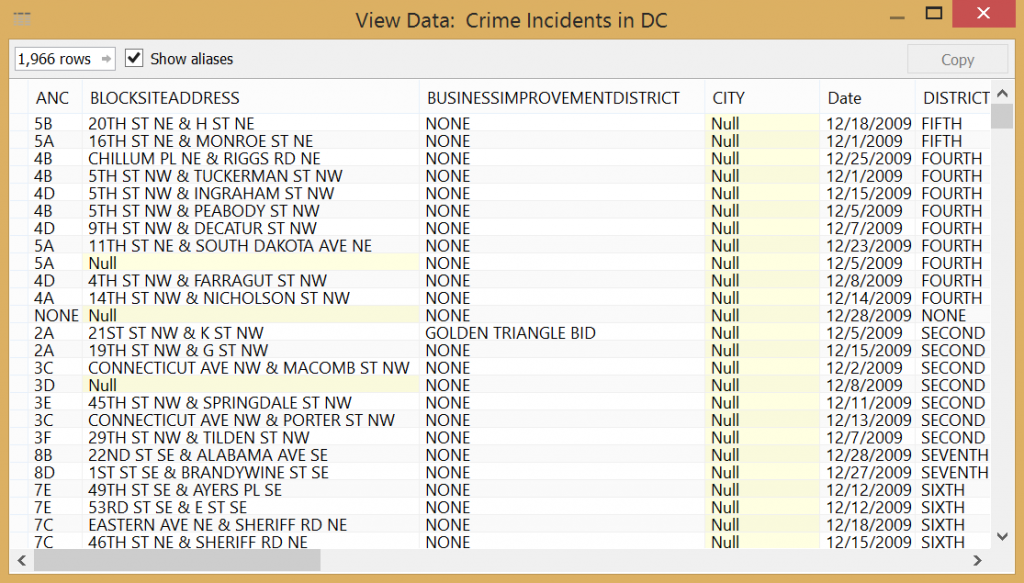 - Which dimensions / measures constitute the view? What is discreet (blue pill), what is continuous (green pill)? How are the measures aggregated? What is on the Columns, what is on the Rows shelf? What if you swap the fields on columns-rows? Experiment, don't worry, Tableau cannot be broken. Are there any fields applied in creating the view but hidden from the user (like an Index() function for ranking but without the Header shown). Use the ’Describe’ functionality after right-clicking on a field in the data window to get information on its content.
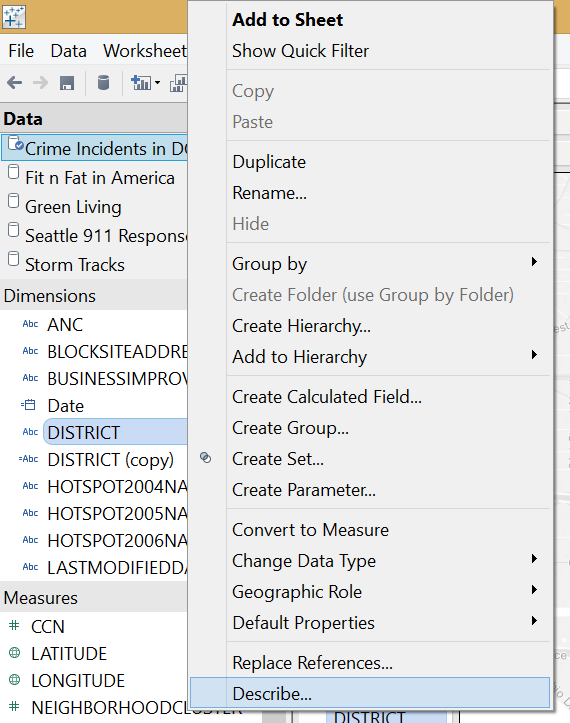
 Is the chart coloured, by what? Are there labels? Click on all the buttons on the marks card to reveal relevant information. Do you spot reference lines, maybe reference bands? What is the mark type of the chart? Why was that chart type chosen? Is it dual axis? Can we filter the view, are there any quickfilters enabled? Do you see filters created by dashboard actions? Do parameter controls appear in the view to enable user interaction? Did the author put fields on the level of detail? Are fields sorted? Do you find hierarchies, groups, sets in the view?Look for the visual cues Tableau is providing on the pills - is the field sorted, is it a table calculation, is it stemming from a secondary data source, is it a set, member of a hierarchy, etc.?To get an overview of a worksheet's content you may also rely on Tableau's 'Describe Sheet' option (accessible at Worksheet menu/Describe Sheet or via the CTRL+E hotkey).
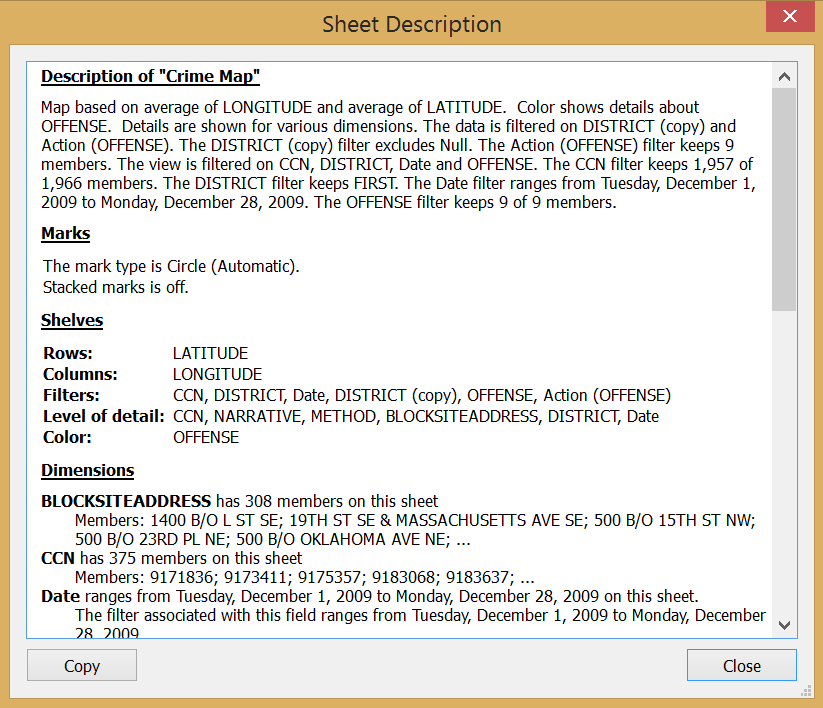 Most of worksheets you will understand very quickly. Look out for calculated fields, look into how they were created. Were parameters inserted in the formulas? Explore table calculations. Usually these two areas (calculated fields and table calculations) take the longest to comprehend when dealing with dashboards created by someone else. Often you have to roll back a formula of a calculated field through several others until you reach the starting point, i.e. fields originally given in the data source. (Right click on the calculated field's name in the data window and select 'Edit...' to open the Field editor window where you will see how the field was created.) Sometimes you encounter a complex mathematical formula that calls for additional readings beyond Tableau.Play with the visualisations. What happens when you remove a field from the view? Possibly one you are unfamiliar with, the purpose of which you do not yet understand. Then put it back into the view. How does the chart behave if you change the logic of table calculations (e.g. addressing and partitioning).Try to link in your imagination every field on the sheets and every action on the dashboards to a functionality visible for the user. If you get stuck in this reverse process, read more about the respective item and experiment with it (e.g.change the visualisation type or remove, re-add the field to the view and examine what changes).After these steps you should be in a position to recreate the worksheets. You may do this and also organize them into dashboards, adding the relevant actions to match the functionalities of the original workbook. Though you may skip this step if you are convinced you fully understand the logic behind the views.What is the difference when a more advanced user applies reverse engineering?At this point we revert back to a point made earlier about the two typical cases when this method is applied. If something is broken in the workbook and an advanced user attempts to correct it, the solution usually hides in the very details.These may be:- data blending (is it happening on the right fields and if a hierarchy is involved - on the right level)- complex formulas of calculated fields (even though a formula is correct syntactically and indicated as valid by Tableau, it may be inaccurate business-wise).- subtle issues with the visualisation (font sizes, non-descriptive titles, unnecessary labels, cluttered or empty view, wrong color selection, unfitting chart type, number formatting issues and we could continue)- defects in user friendliness (tooltip structure, missing user guidelines, unfriendly filter or parameter control type, inconsistent actions on the dashboard, etc.)- inaccurate order / span of operations (e.g. a filter should be in context but it is not, hence the chart produces different results or a quickfilter accidentally does not apply to all the intended views or not all required fields are passed by a filter action)- lack of optimisation for performance (a data source filter could be used, apply button at quickfilters, etc.)Reverse engineering with the purpose of optimising / correcting a workbook is very different from the general learning case. We may cover this in a later blog post in more details.All in all, do not be discouraged if finding the logic takes longer than expected, the harder it is, the more you learn in the end. So good luck with reverse engineering!
 Now you are familiar with the span of the workbook, meaning whether you have to walk through one or five dashboards, etc. I explain the following steps as if we had a single dashboard workbook. Everything is repetitive in case of multiple dashboards.3. Explore the layout and mechanics of the dashboardWhere are the worksheets located on the dashboard? How many of them? Tiled or floating? What actions are available, how are the different views (worksheets) connected on the dashboard? How many views do each quickfilter affect? Are there worksheets hidden until we select a mark somewhere else?The 'Dashboard' window on the left lists the worksheets displayed on the dashboard (denoted by a little checkmark on the worksheet icon) as well as the worksheets not applied but unhidden in the workbook. Should you not see this part of the window, make sure the Window/Show Side Bar menu option is checked.What if the workbook tells a Story? The logic is the same, on the left hand side of the window you will find a 'Dashboards and Worksheets' panel from where you can navigate to any item.The next step goes into the details, to the essence of reverse engineering. Repeat this analysis for all worksheets.4. Break down the views to their smallest building blocksGo to the worksheet from the dashboard it is displayed on. If necessary, unhide the worksheet. The examples are taken from the Science workbook, shipped with Tableau Desktop.
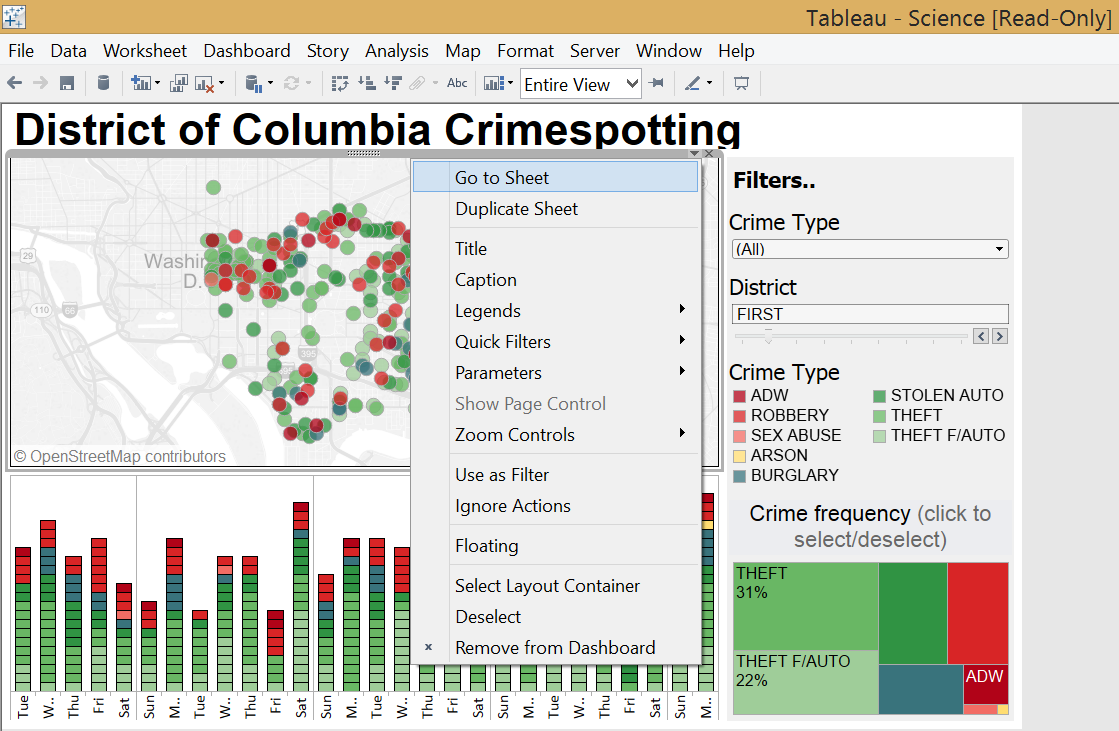 - What data sources are used to create the view? Is it built of only one data source or the primary data source was blended with a secondary one (look for the orange colour denoting a secondary data source in the Data Window and a measure/dimension in the view, taken from the secondary data source). Expore the data connection Properties and also view the data to see the structure, the fields.Data connection properties: Viewing data:
  - Which dimensions / measures constitute the view? What is discreet (blue pill), what is continuous (green pill)? How are the measures aggregated? What is on the Columns, what is on the Rows shelf? What if you swap the fields on columns-rows? Experiment, don't worry, Tableau cannot be broken. Are there any fields applied in creating the view but hidden from the user (like an Index() function for ranking but without the Header shown). Use the ’Describe’ functionality after right-clicking on a field in the data window to get information on its content. Is the chart coloured, by what? Are there labels? Click on all the buttons on the marks card to reveal relevant information. Do you spot reference lines, maybe reference bands? What is the mark type of the chart? Why was that chart type chosen? Is it dual axis? Can we filter the view, are there any quickfilters enabled? Do you see filters created by dashboard actions? Do parameter controls appear in the view to enable user interaction? Did the author put fields on the level of detail? Are fields sorted? Do you find hierarchies, groups, sets in the view?Look for the visual cues Tableau is providing on the pills - is the field sorted, is it a table calculation, is it stemming from a secondary data source, is it a set, member of a hierarchy, etc.?To get an overview of a worksheet's content you may also rely on Tableau's 'Describe Sheet' option (accessible at Worksheet menu/Describe Sheet or via the CTRL+E hotkey).Most of worksheets you will understand very quickly. Look out for calculated fields, look into how they were created. Were parameters inserted in the formulas? Explore table calculations. Usually these two areas (calculated fields and table calculations) take the longest to comprehend when dealing with dashboards created by someone else. Often you have to roll back a formula of a calculated field through several others until you reach the starting point, i.e. fields originally given in the data source. (Right click on the calculated field's name in the data window and select 'Edit...' to open the Field editor window where you will see how the field was created.) Sometimes you encounter a complex mathematical formula that calls for additional readings beyond Tableau.Play with the visualisations. What happens when you remove a field from the view? Possibly one you are unfamiliar with, the purpose of which you do not yet understand. Then put it back into the view. How does the chart behave if you change the logic of table calculations (e.g. addressing and partitioning).Try to link in your imagination every field on the sheets and every action on the dashboards to a functionality visible for the user. If you get stuck in this reverse process, read more about the respective item and experiment with it (e.g.change the visualisation type or remove, re-add the field to the view and examine what changes).After these steps you should be in a position to recreate the worksheets. You may do this and also organize them into dashboards, adding the relevant actions to match the functionalities of the original workbook. Though you may skip this step if you are convinced you fully understand the logic behind the views.What is the difference when a more advanced user applies reverse engineering?At this point we revert back to a point made earlier about the two typical cases when this method is applied. If something is broken in the workbook and an advanced user attempts to correct it, the solution usually hides in the very details.These may be:- data blending (is it happening on the right fields and if a hierarchy is involved - on the right level)- complex formulas of calculated fields (even though a formula is correct syntactically and indicated as valid by Tableau, it may be inaccurate business-wise).- subtle issues with the visualisation (font sizes, non-descriptive titles, unnecessary labels, cluttered or empty view, wrong color selection, unfitting chart type, number formatting issues and we could continue)- defects in user friendliness (tooltip structure, missing user guidelines, unfriendly filter or parameter control type, inconsistent actions on the dashboard, etc.)- inaccurate order / span of operations (e.g. a filter should be in context but it is not, hence the chart produces different results or a quickfilter accidentally does not apply to all the intended views or not all required fields are passed by a filter action)- lack of optimisation for performance (a data source filter could be used, apply button at quickfilters, etc.)Reverse engineering with the purpose of optimising / correcting a workbook is very different from the general learning case. We may cover this in a later blog post in more details.All in all, do not be discouraged if finding the logic takes longer than expected, the harder it is, the more you learn in the end. So good luck with reverse engineering!