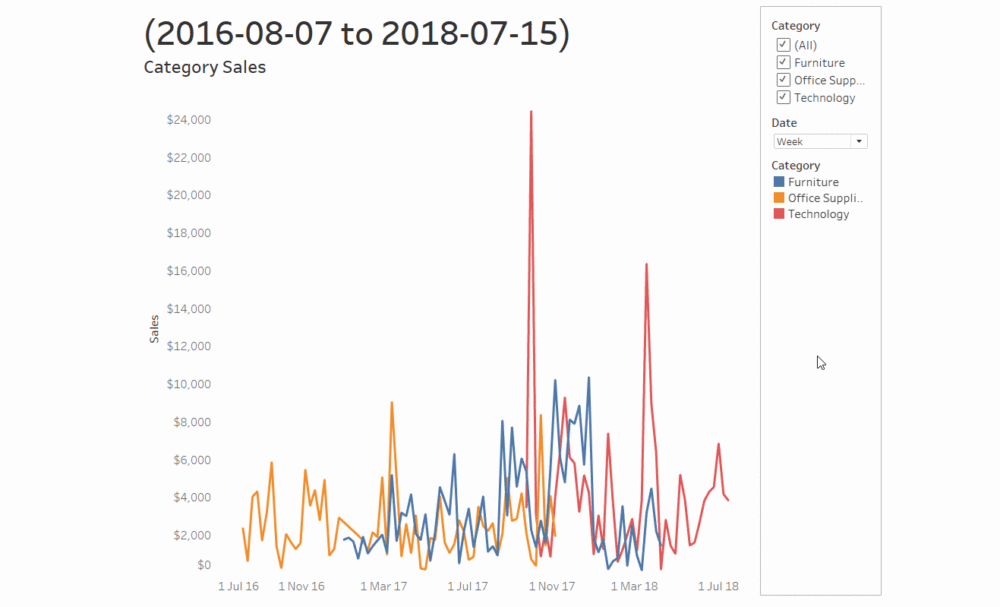
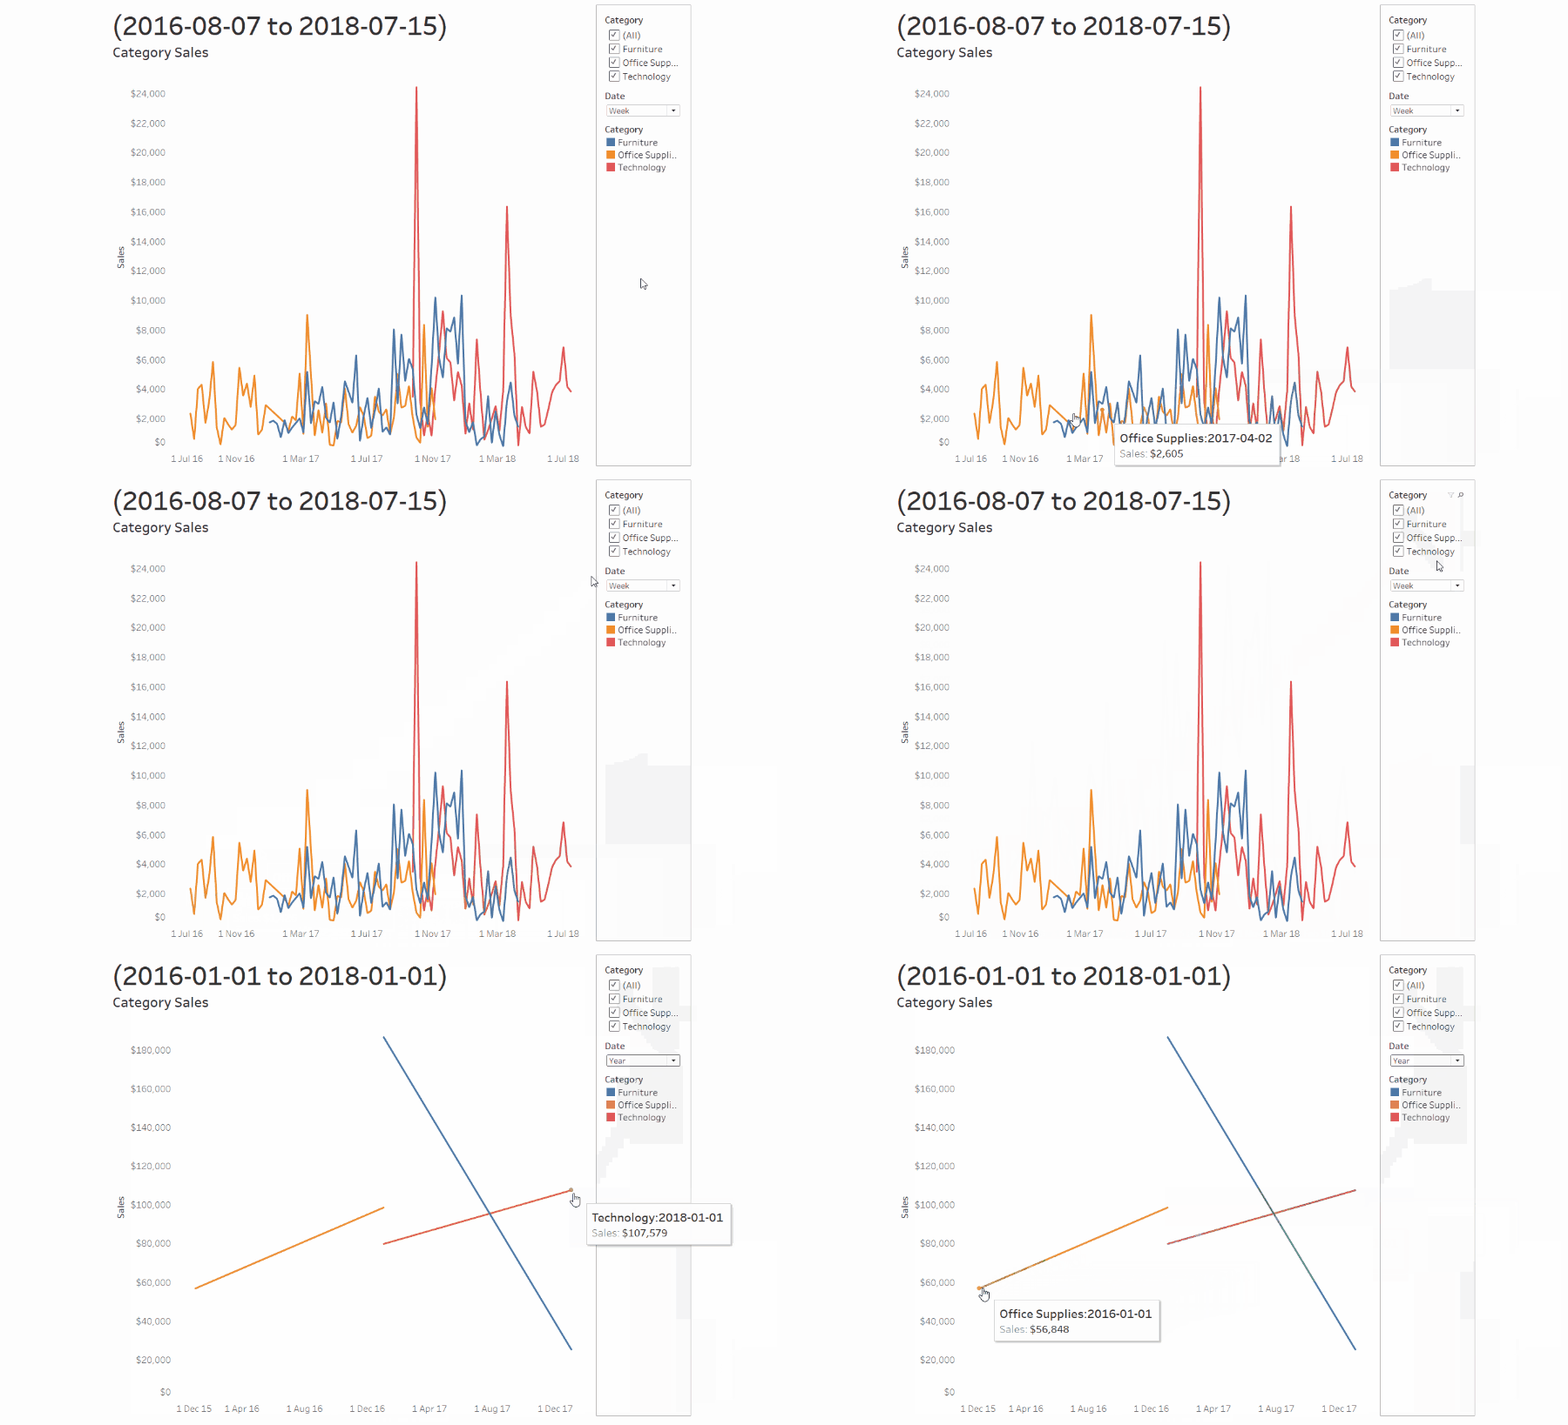
Descriptive titles are really important when making vizzes. They show your uses, at a glance, what you want them to know. They also mean that users don't have to hunt through different legends around your dashboard to understand what it is they're seeing.
When showing trends over time, I've taken to including the date range in the title of each viz, so my users don't have to scan the axes. This also means I can make my axes less prominent, giving more attention to the data I want to show.
I would normally use FIXED Level of Detail calculations to return the maximum and minimum dates in the data-set and then add those calcs to my sheet titles. This worked well until I had filters applying to the sheets, then I had to either edit my LODs to INCLUDE/EXCLUDE or add the filters to context. Not the end of the world, but at this point I'm writing multiple calculations to give me one line of text in a chart title so I went looking for a better way.
Window functions to the rescue
Window functions are a special type of table calculations in Tableau. They allow you to define a 'window' over which their aggregations apply. To quote Tableau:
The window is defined by means of offsets from the current row. Use FIRST()+n and LAST()-n for offsets from the first or last row in the partition. If the start and end are omitted, the entire partition is used.
Tableau's online help
The key thing to take on here is that if we don't explicitly define the window, Tableau will take that to mean everything in the view should be included.
Properly set up, WINDOW_AVG(SUM([Sales])) will return the average of all the sales in view. If we change what's in the view by applying filters, this average will likewise change.
So we can use WINDOW_MIN(MIN([Date])) to return the minimum date that is in the view. That's not surprising, but did you know you can also use it to return the maximum date in the view at the same time?
Setting it up
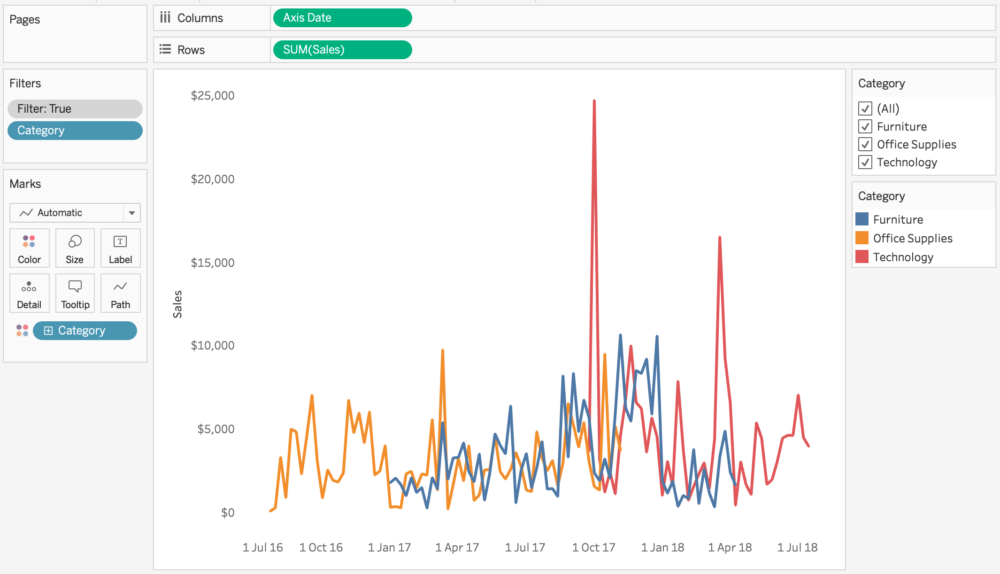
Here I've shown the sum of sales by category for each week. (The context filter isn't important - it just filters different categories to different date ranges. Axis date is a date field truncated to a parameterised value)
Next up I write a calculated field called 'Date' as follows:
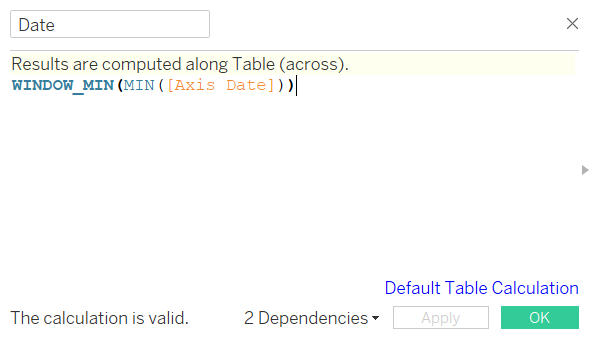
This field returns the minimum date found in the window. Window functions require their fields to be aggregated. In this case I went with MIN(), but for our purposes we could have used MAX() or AVG() as they would return the same value.
We then add this field to detail setting it up as a Continuous field and computing it using 'Cell'.
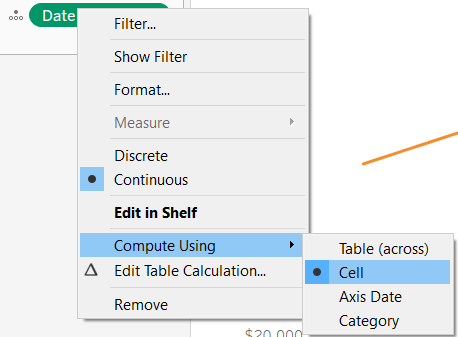
By computing using Cell, the window function returns the minimum date for every date/category combination. In other words, it returns every date. By ensuring the field is continuous, Tableau will give us the range of values rather than 'All'.
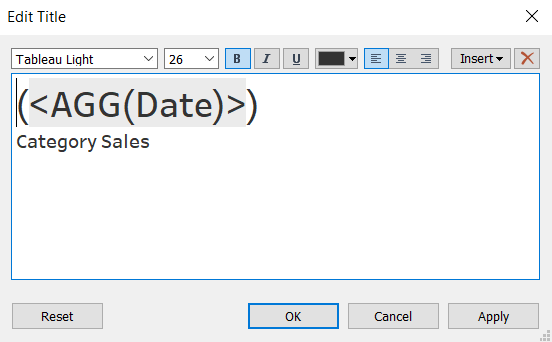
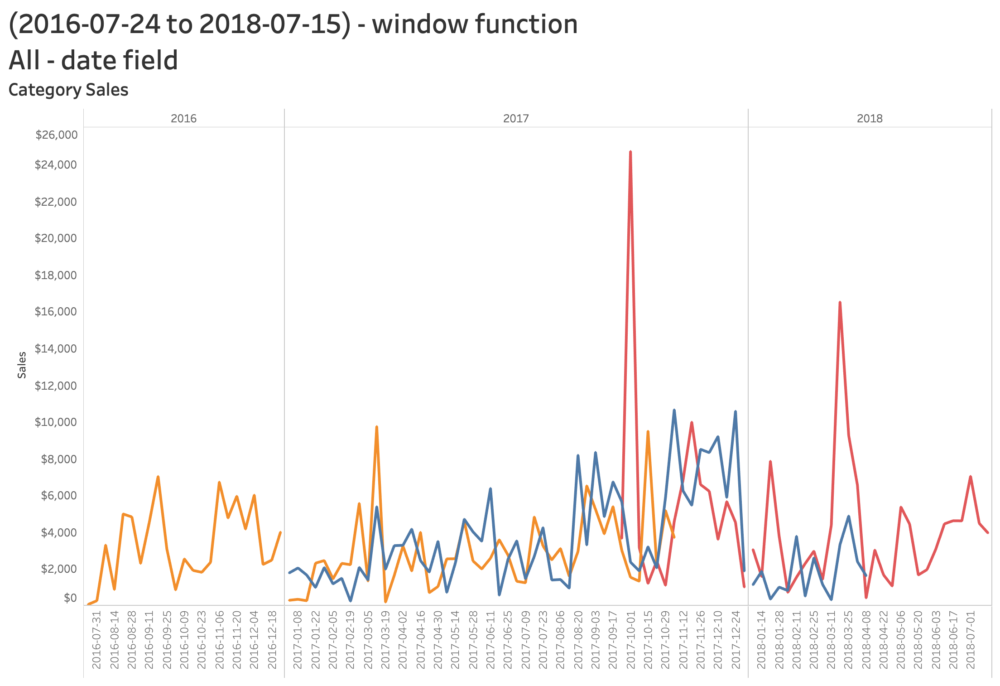
We then add this field to our title (in ludicrously big font) and click OK. Now we have our lovely date range title, which updates whenever filters are applied.

Why use a window function?
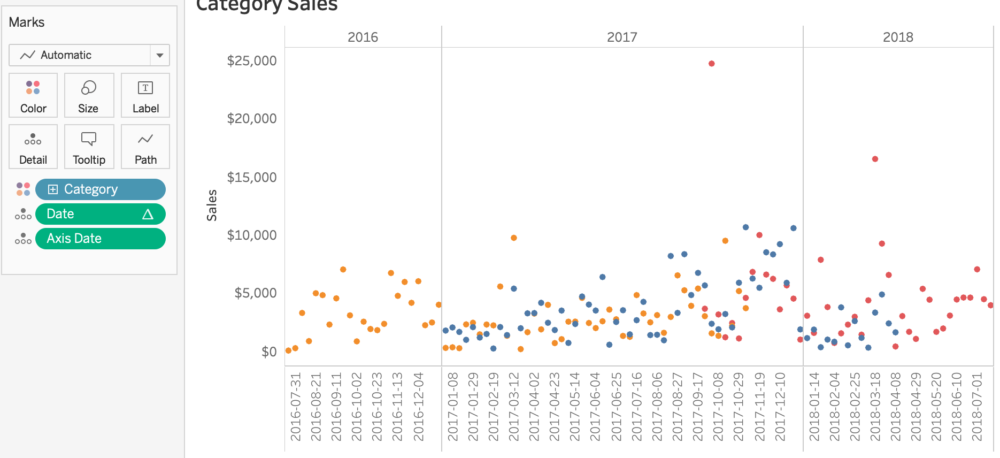
In this situation, we could achieve the same affect by using Axis Date in our title. However, if we use a discrete date field, or combination of discrete and continuous then our title wouldn't work. It would return 'All' rather than the actual range of dates. We might try to counteract this by adding a continuous version of the same date field onto detail, in the hope of using that field in the title. However, this can break up our view and turn our lovely line charts into unintentional dot plots. The window function falls foul of neither of these traps.
So there you have it, one simple calculation to accurately title all your dates. You can find an accompanying workbook to this blog here, and if you have any questions you can find me on twitter @olliehclarke.
