The goal of this tutorial is to show you how you can embed Tableau into a web portal in the simplest way possible.
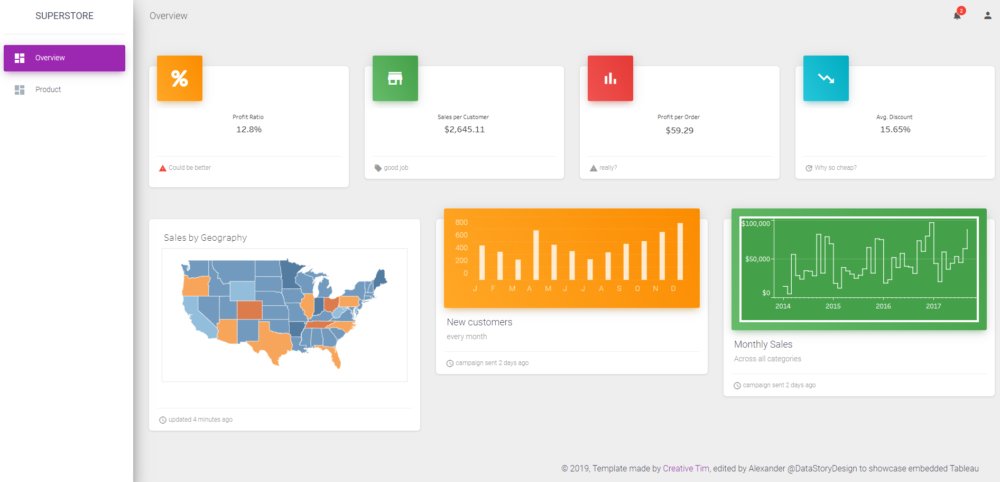
Here is the example we will be going through:
https://superstore.theinformationlab.io
You can find the code here.

The web portal template was made by Creative Tim:
https://www.creative-tim.com/product/material-dashboard
The embed licence and the Javascript API
First of all, we need to distinguish between embed as a licence and embed as a method.
You can, of course, embed Tableau dashboards using a normal Tableau server. However, if you want the dashboard to be publically facing or if you're selling access to clients, it makes more sense with an embed licence. That is unless you want to give everyone access to your server.
Using the Tableau Javascript API we can embed Tableau sheets and dashboards into any web portal with a few customisation options.
The practicalities
How to practically embed a Tableau visualisation is a simple 4 step process:
1. Tell the browser where to find the API
Open up your HTML file (in our case index.html) and make sure you have this script in your HTML document. Just replace The Information Lab web address with the web address of your server.
<!-- Tableau javascript API --><script src='https://clientreporting.theinformationlab.co.uk/javascripts/api/tableau-2.min.js'></script>What this does is that it tells your browser where to find the tableau-2.min.js file which contains the Tableau Javascript API instructions.
2. Use the API to display the visualisations that you want
Now you need to write a Javascript function to make a request to your server for a specific sheet or dashboard.
There are many ways to do this, here we will focus on the simplest way of doing it. Just keep in mind that there other ways which can be better depending on your situation and familiarity with Javascript.
First let's create a new javascript file, like script.js and put the following code into it:
//Tableau Embed functionfunction initViz() {url = 'https://clientreporting.theinformationlab.co.uk/t/PublicDemo/views/Superstoreforembeded/MonthlySales',options = {hideToolbar: true,width: '100%',height: '200px',};viz = new tableau.Viz(tabMonthlySales, url, options);}Let's connect this new script.js file to our index.html file by putting this snippet in our HTML:
<!-- Tableau embed scripts --><script src='assets/js/script.js'></script>Now let's go through what each of the elements in our script.js means.
function initViz() { }First, we just create a normal Javascript function. We can call it whatever we want, Tableau just suggests we call it initViz as a shorthand for initialise visualisation because that is literally what the function is doing. Its always good to have names that make sense.
url = 'https://clientreporting.theinformationlab.co.uk/t/PublicDemo/views/Superstoreforembeded/MonthlySales',
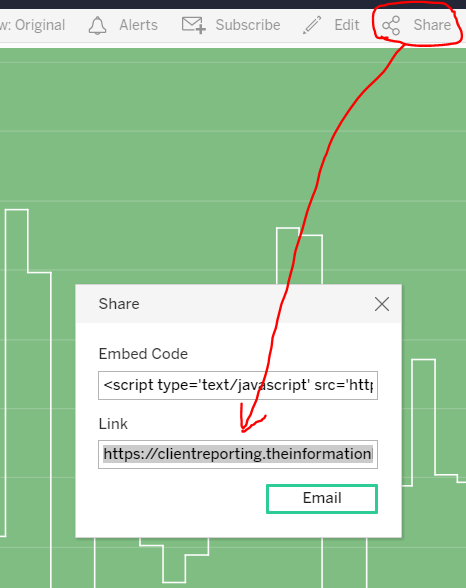
Here we are simply specifying what sheet or dashboard we want to display. You can get this url from your server by clicking on share and grabbing the embed link.
https://clientreporting.theinformationlab.co.uk/t/PublicDemo/views/Superstoreforembeded/MonthlySales?iframeSizedToWindow=true&:embed=y&:showAppBanner=false&:display_count=no&:showVizHome=no&:origin=viz_share_linkFeel free to delete everything starting from the question mark since that's just options which we don't want right now.
options = {hideToolbar: true,width: '100%',height: '200px',};The options we do want are listed in the code above:
- We want to hide the toolbar
- We want the visualisation to fill the width of the parent container.
- We want the height of the visualisation to be 200px.
There are some other options possible, which you can find here.
viz = new tableau.Viz(tabMonthlySales, url, options);What we are doing here is creating a new variable called viz.
We are then saying that our viz variable should contain a new method from the API called tableau.Viz(). Finally, we are saying that we want to run that method on the three variables we specified, tabMonthlySales, url and options. What this method does is grab the viz specified in the url, apply the specified options and display it within the container of tabMonthlySales.
Now you might be wondering, I know about url and options but where did the variable tabMonthlySales come from?
It is a variable we create and you can call it whatever you want. However, since it is referring to our monthly sales visualisation I decided to call it tabMonthlySales. It will all make sense once you read step 3.
You can also initialise multiple sheets/dashboards with one function.
//Tableau Embed functionfunction initViz() {url = 'https://clientreporting.theinformationlab.co.uk/t/PublicDemo/views/Superstoreforembeded/ProfitperOrder',options = {hideToolbar: true,width: '100%',height: '70px',};viz = new tableau.Viz(tabProfitPerOrder, url, options);url = 'https://clientreporting.theinformationlab.co.uk/t/PublicDemo/views/Superstoreforembeded/MonthlySales',options = {hideToolbar: true,width: '100%',height: '200px',};viz = new tableau.Viz(tabMonthlySales, url, options);}3. Choose where the visualisations should be located
Now let's go to our index.html file. The HTML file is where the structure of the website is and it's where we can choose where we want to display our visualisations.
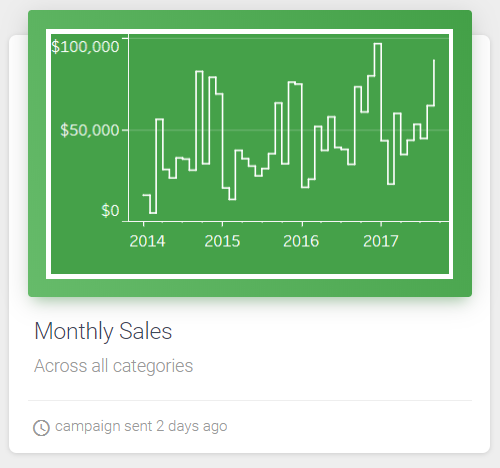
Here below you'll see where the Monthly Sales visualisation is placed.
It's nested inside 4 containers (div's):

- The first level container just says that it takes up 1/3 of the screen (since its a 12 column grid and this container uses 4 out of the 12 columns).
- The second level container is where the white box is.
- The third level container is where the green box is.
- The fourth level container, inside the green box, is where we are displaying our visualisation and the answer to the question of 'where does tabMonthlySales come from?'
<div class='col-md-4'><div class='card card-chart'><div class='card-header card-header-success'><div id='tabMonthlySales'></div></div><div class='card-body'><h4 class='card-title'>Monthly Sales</h4><p class='card-category'>Across all categories</p></div><div class='card-footer'><div class='stats'><i class='material-icons'>access_time</i> campaign sent 2 days ago</div></div></div></div>The main things to remember here is that you can call this variable whatever you want, it just needs to have the same name in both your HTML and Javascript file.
viz = new tableau.Viz(tabMonthlySales, url, options);<div id='tabMonthlySales'></div>4. Tell your browser to load the visualisation
The last thing we need to do is tell the browser to run our Javascript function initViz().
The simplest way to do that is putting this in your body HTML tag
<body onload='initViz();'>What this does is that it makes sure the initViz() function runs when you see the body tag, which is part of our index.html. Therefore when you open index.html the function runs with it.
Some things to keep in mind

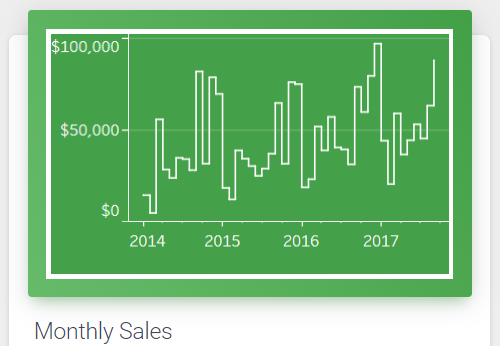
- Tableau always adds a white border around the visualisation, which works fine on a white background but can be quite annoying on a coloured background. Unfortunately, there is no way I've found to remove it. Let us know in the comments if you found a way to do it.
- Sheets vs dashboards - if you are embedding visualisations into a small space, you'll have a much easier time using sheets rather than dashboards. That is because Tableau insists that each dashboard in a workbook should be the same height, regardless of its actual height, which results in a massive scrollbar for small dashboards.

- No transparent sheets - say you have a coloured background like this image. Even if you make the background transparent, when you embed it the background will be white. You therefore need to set the colour in Tableau to match your background colour on the website.
