
This isn't my favourite use of Tableau by any stretch of the imagination, but it's something that comes up now and again when doing Tableau consulting:
'I've got a massive table, which is fine to scroll through online, but I can't print it. How can I print out this table over multiple pages while keeping all the dashboard formatting and the column headers?'.
My solution to this uses a parameter and a running total calculation using the [Number of Records] field. You can download my workbook from Tableau Public here, and then follow the instructions below.
First of all, let's create a big old table, something a little like this:
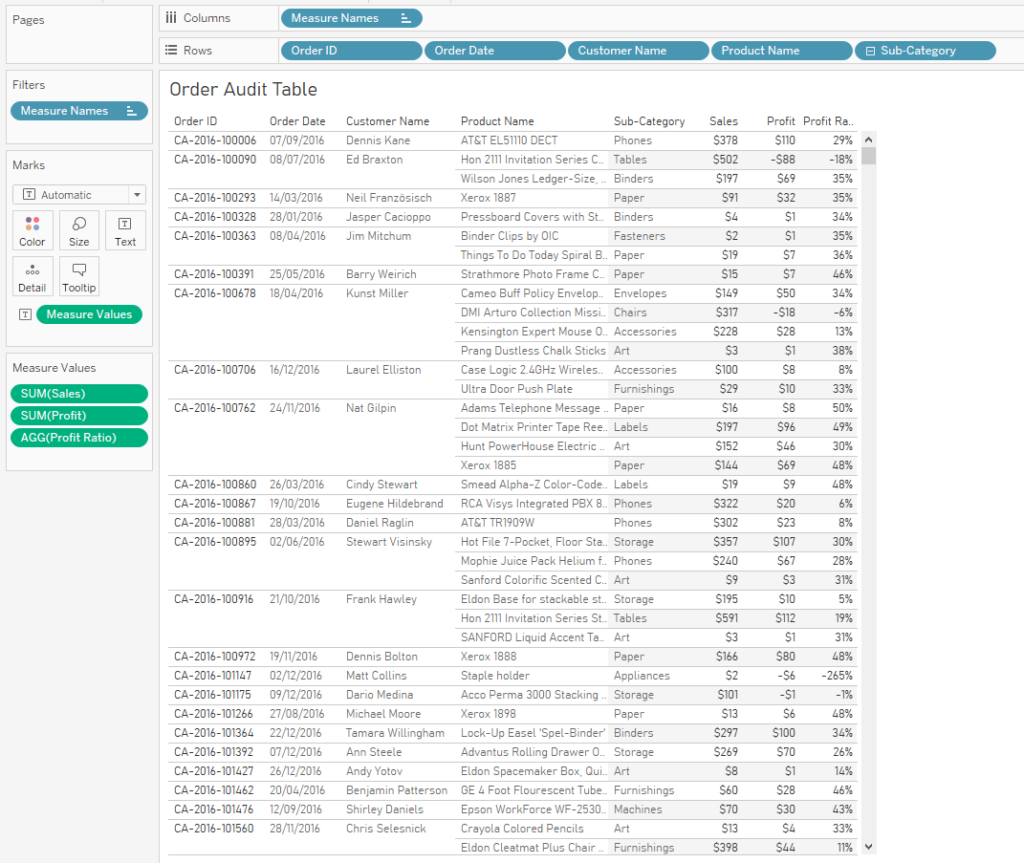
It's got almost 10,000 rows in it. That's fine when you've got an interactive scroll bar and you're working with it online, but not so much if you need to create static print outs.
So, the next step is to find a way of making it into pages. What I want to do is put the table on a dashboard, like this:
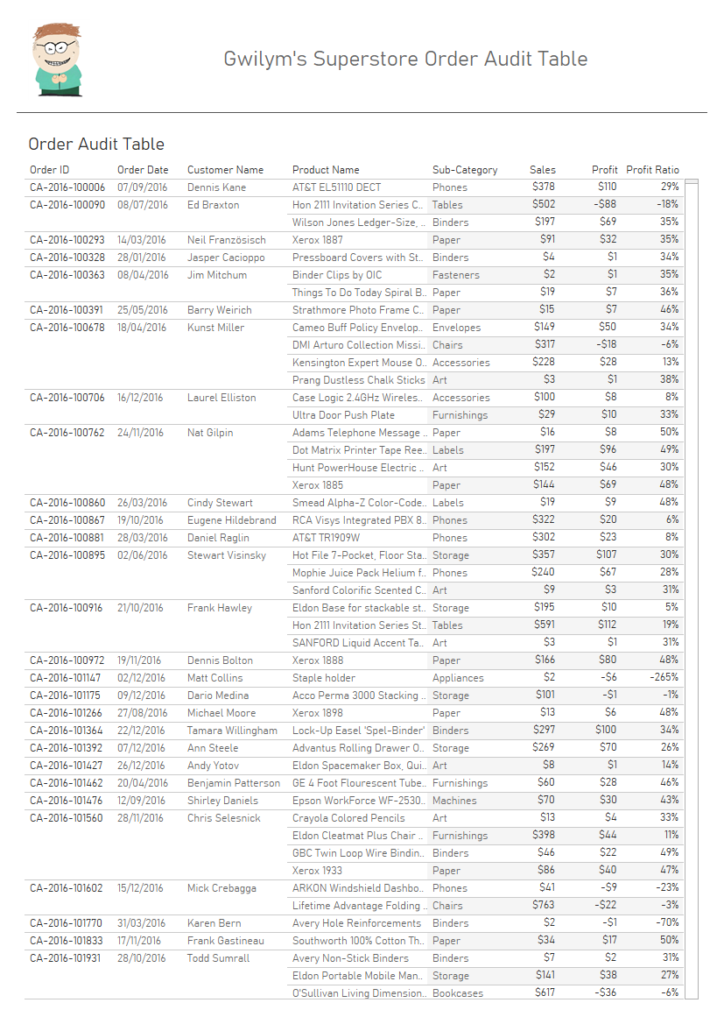
...and instead of having a scroll bar, I want to fit the data to however many rows fit on the dashboard, and then repeat that dashboard as many times as necessary.
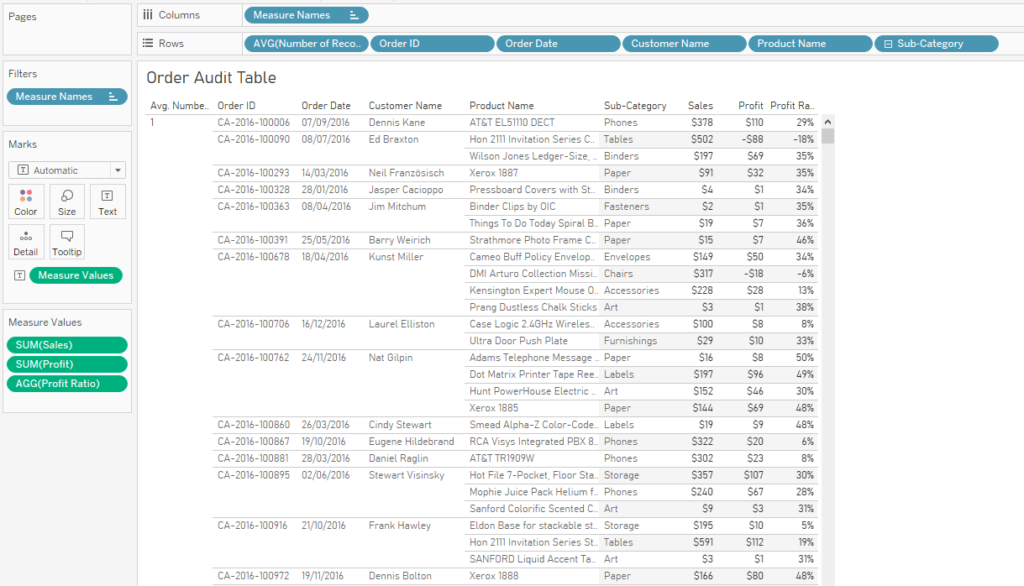
Let's bring in the AVG([Number of Records]), and switch it to discrete so it functions like a row number where the row number is 1 for each row:
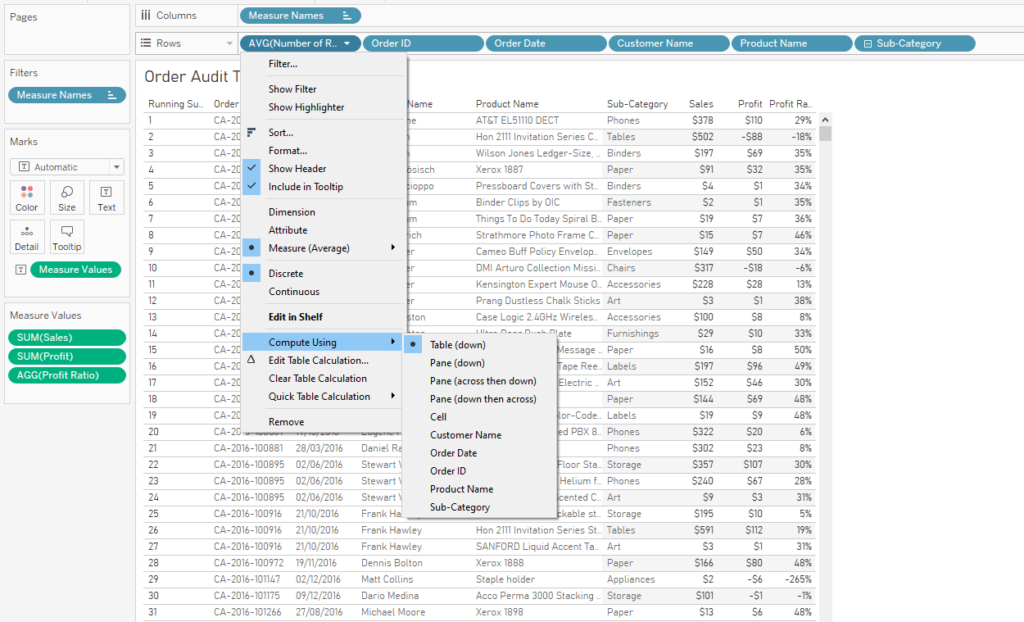
Now let's add a running total table calculation to it, computing along Table (down). This gives us a dynamic Row ID:
The next step is to create a parameter to select the page number. You'll need to make it an integer with any allowable value.
Now, we can divide the table into pages. I've decided that I'd like to show 25 rows on each page, mostly because that's an easy number to work with in my head - I know that there'll be 4 pages for each 100 rows in the data.
We can use the following logic to determine where my 25 row pages start and end:
((RUNNING_SUM(AVG([Number of Records]))-1) / 25) + 1
This is a few more brackets than are technically necessary, but I find that it clarifies the purpose of the calculation. It takes the dynamic Row ID we've created, and subtracts 1 from it, so that it goes like 0, 1, 2, 3... instead of 1, 2, 3, 4... and so on. Then, it divides that number by 25, which is the number of rows I want in each table page. Finally, it adds 1 to the whole thing.
This tells us where each page will be:

Why does it subtract 1 and then add 1 again? The first -1 is in order to make sure that all pages have the same number of rows on them. If the Row ID begins on 1, then the first page will always have one row fewer on it, as it'll take rows 1-24, then the second page will take rows 25-49. Subtracting 1 means that the first page will take rows 0-24, then the second page will take rows 25-49. Then, after dividing the Row IDs by 25, the first page will have a number between 0 and 1. Talking about the first page as page 0 and the second page as page 1 always gets confusing, so I've added 1 back on to make it more intuitive.
Now that we've got that logic understood, we can create a Page Filter calculated field:
((RUNNING_SUM(AVG([Number of Records]))-1) / 25) + 1 >= [Page Selector]
AND
((RUNNING_SUM(AVG([Number of Records]))-1) / 25) + 1 < [Page Selector] + 1
This filters the table to whichever page you've selected in the page selection parameter. So, if you've selected page 4, it'll give you all values where the Row ID divided by the number of rows you want per page is >= 4 and < 5. This corresponds to rows 76-100.

Now that the filter is set up correctly, we can get rid of the first two columns in this table entirely and leave it to work in the background. You can put the new version of your table into a dashboard along with the page selector parameter. Tableau also lets you set the dashboard size to common printer paper sizes, so I've set this to A4 portrait:
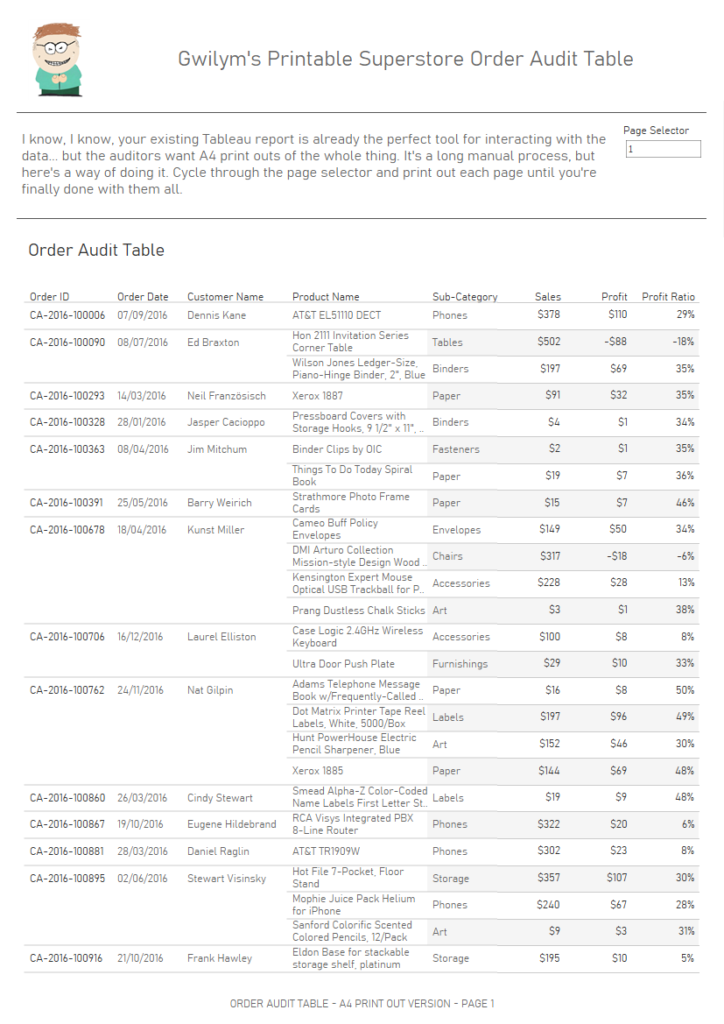
Now, if you need to print out the entire table in a consistent format, you can cycle through all the pages and print them individually. This will obviously take a lot of time for big tables, and it won't be a pleasant experience, but it does at least make it possible for you!
