

21 July 2015
In a previous blog we went through the process of downloading some data from the website Quandl. Again, if you aren’t aware of this website, do check it out!Previously, the JSON Parse Tool was set up so that the data output values into a single string which gives four columns:Field Name, DownloadHeaders, JSON_Name and JSON_ValueString.If you select 'Output values into data type specific fields' the JSON Parse Tool output will have seven columns:Field Name, DownloadHeaders, JSON_Name, JSON_ValueString, JSON_ValueInt, JSON_ValueFloat and JSON_ValueBool.It’s always worth checking what these fields contain using the Browse Tool and matching each field to the JSON_Name field. What you’ll find in the JSON_ValueString is all the date records amongst other information, in the JSON_ValueFloat all the data and some redundant data in the JSON_ValueInt and JSON_ValueBool fields.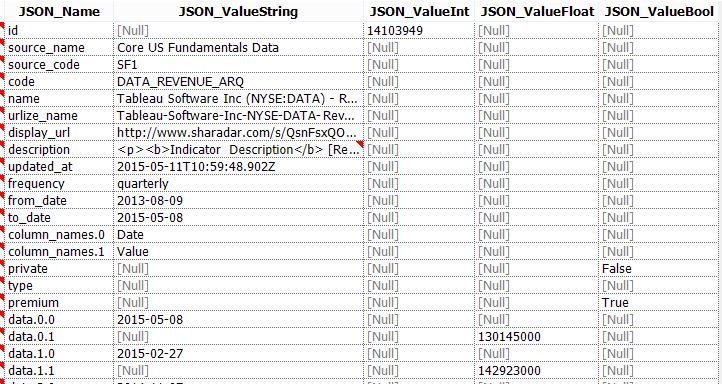 This output, therefore, requires a few different steps to reach the same end result as before.Essentially what we need to do is to separate the dates from the JSON_ValueString and the data records from the JSON_ValueFloat into two sets and then join them back up at the end.After using the Text To Columns Tool, the first step is to cross-tab the data.Before using the Cross Tab Tool I removed all of the blank rows that correspond to the date by using a filter to remove any rows where JSON_Name3 = 0If you are trying to download a more detailed dataset, for example stocks, then you need a Select Tool to change the JSON_Name2 into an integer data type otherwise the cross-tab will sort the data alphabetically, as it reads the field as a string.It's also worth removing some of the unwanted fields at this stage too.
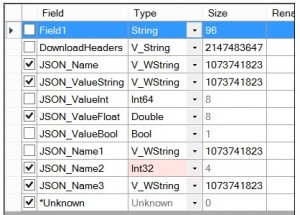 There should now be 8 records coming out of the Cross Tab Tool.The date part of the data can be extracted using a Filter Tool to remove all Null rows from the JSON_ValueString field.What I also like to do is convert strings into date format using the DateTime Tool. This will further prepare the data, ready for analysis in Tableau :)Lastly add a Record ID Tool to both data sets and join them, using this ID field with a Join Tool.In order to get the column names you’ll need to extract them from the metadata again.Use a filter tool to select only JSON_Names that contain “column_names” then select just the JSON_ValueString and use the Dynamic Rename Tool to relabel the headers.In an upcoming blog I’m going to explore downloading multiple data sets using this approach, organize them and use a trellis plot, all created in Tableau, to analyse correlations between downloaded API data.Stay tuned for more examples of connecting Alteryx to an API. If you have any questions or comments, please use the form below or get in touch using info@theinformationlab.co.uk
This output, therefore, requires a few different steps to reach the same end result as before.Essentially what we need to do is to separate the dates from the JSON_ValueString and the data records from the JSON_ValueFloat into two sets and then join them back up at the end.After using the Text To Columns Tool, the first step is to cross-tab the data.Before using the Cross Tab Tool I removed all of the blank rows that correspond to the date by using a filter to remove any rows where JSON_Name3 = 0If you are trying to download a more detailed dataset, for example stocks, then you need a Select Tool to change the JSON_Name2 into an integer data type otherwise the cross-tab will sort the data alphabetically, as it reads the field as a string.It's also worth removing some of the unwanted fields at this stage too.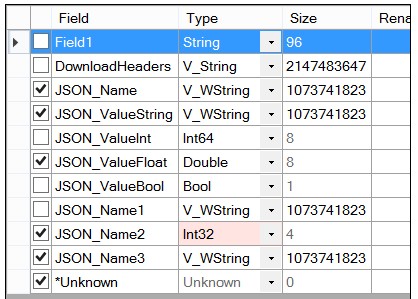 There should now be 8 records coming out of the Cross Tab Tool.The date part of the data can be extracted using a Filter Tool to remove all Null rows from the JSON_ValueString field.What I also like to do is convert strings into date format using the DateTime Tool. This will further prepare the data, ready for analysis in Tableau :)Lastly add a Record ID Tool to both data sets and join them, using this ID field with a Join Tool.In order to get the column names you’ll need to extract them from the metadata again.Use a filter tool to select only JSON_Names that contain “column_names” then select just the JSON_ValueString and use the Dynamic Rename Tool to relabel the headers.In an upcoming blog I’m going to explore downloading multiple data sets using this approach, organize them and use a trellis plot, all created in Tableau, to analyse correlations between downloaded API data.Stay tuned for more examples of connecting Alteryx to an API. If you have any questions or comments, please use the form below or get in touch using info@theinformationlab.co.uk