

Google Maps API
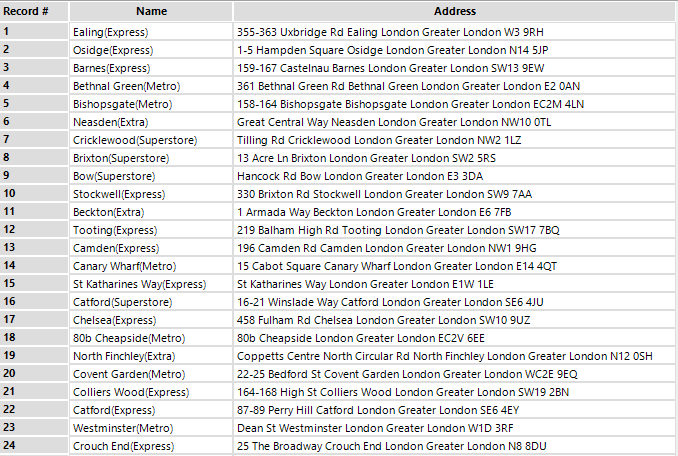
Our objective is to transform those addresses into geographical coordinates that we can use to map all stores in Alteryx or Tableau and perform additional analysis. Google Maps API allows as to do this, and we can use Alteryx to run all the necessary queries to do it with less than a dozen of tools. More concretely, we have use the Geocoding API using this structure for the requests:https://maps.googleapis.com/maps/api/geocode/output?parameters
In the 'output' we have to choose between one of the two available options: json or xml. And the required parameters in each geocoding request are an address or components, and the key. In the previous link there's more detailed information about all the possible parameters, but in resume the format of the request must be something like this:
https://maps.googleapis.com/maps/api/geocode/json?address=21+Caledonian+Rd+London+Greater+London+N1+9DX&components=country:UK&key=MY_KEY
The address must not have any whitespaces, separating instead each word of the address by '+' and we added a component country=UK to limit the geocoding to the United Kingdom in case there are similar address in other countries (shouldn't be an issue in this case, because the address is very detailed). We have decided to get the outputj in json format instad of xml.
How to obtain the Key?
Is very easy, and it's free. You can get your own key through this link and it doesn't take more than a couple of minutes. Or we can also get it through Google's Developers Portal. Where we can also check the use that of the service with our Key and we can even create several types of restrictions, like based on a concrete IP to avoid quota theft. Yes, because the service is free, but it has some limitations.API usage limits
There's a very detailed documentation about the API limitations here. In resume, the standard version of the API has a limit of 2,500 free requests per day, calculated as the sum of client-side and server-side queries and 50 requests per second, calculated as the sum of client-side and server-side queries. We can unlock higher quotas paying for the service: $0.50 USD for 1,000 additional requests, up to 100,000 daily. There also a Premium Plan available in case we need to generate a massive number of requests.Quick workflow overview
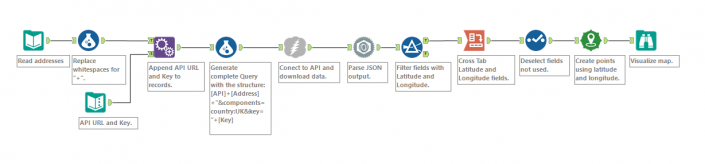
So, now we have our list of addresses and we also have our Key to use the API. Now we just need to build the workflow. For the most impacient, here's how all the workflow looks like:
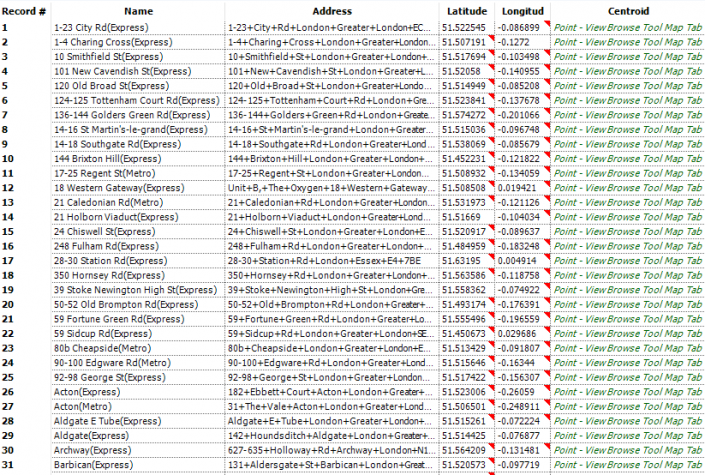
Quite simple isn't it? And here's an image of the output in a table view:
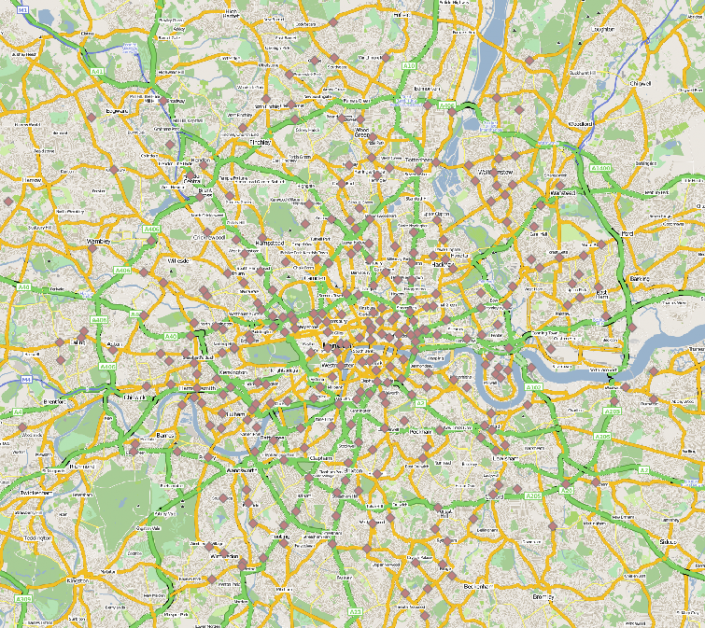
And in a map:
Let's have now a more detailed look at all the workflow.
Inputs, Formulas and Append Fields
These are the first tools that we will use to prepare all the requests we are going to make to the API.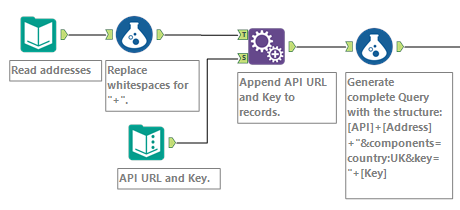 First input tool is just reading the Excel file with the stores and addresses. The second input tool (Text Input to be more precise) it has a column with the initial common part of the request that we saw before: https://maps.googleapis.com/maps/api/geocode/json?address=. And a second column with our API Key that we have also requested previously.Then I'm using a formula tool to modify the Address field, replacing the whitespaces for '+' symbols using the expression REPLACE([Address],' ','+'). The Append tool is appending (surprise!) the API URL and the Key to each record in my list of stores. And the final formula tool generates a new field that I called 'Query' appending all the fields together in a unique string with the entire request for each record.
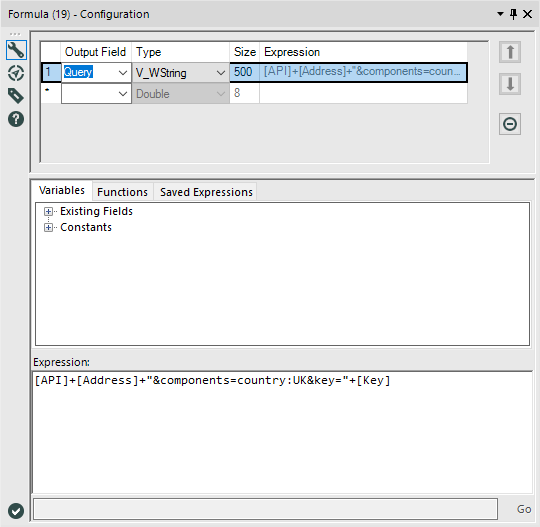
Download, JSON Parse and filtering latitude and longitude
Probably if you are not a very intensive Alteryx user you haven't used Download and JSON Parse before. But you'll see that for this use case the configuration of both of them is very very simple.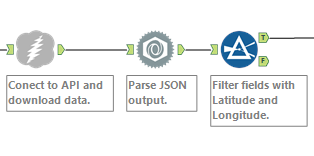 For the Download tool we just need to configure the field that has the URL. In our particular case we just generate that field with the previous Formula tool, and it's the Field named 'Query'. The rest of the configuration options we can leave them as they are by default.
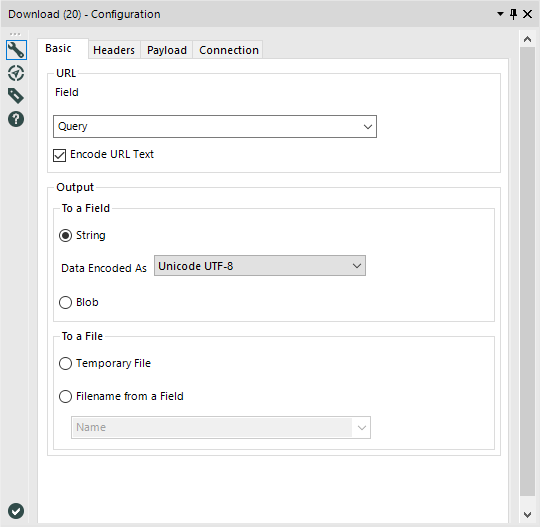 The JSON Parse tool is as easy as the previous one. We need to select the field that we want to parse. In our case is the DownloadData field generated after the Download tool. And I select 'Output values into data type specific fields' to have one column for each type of field that I will receive from the Download tool. But we could also select the other option at it will be fine. This is just to avoid having the latitude and longitude as strings and have those fields as integers already after the download.
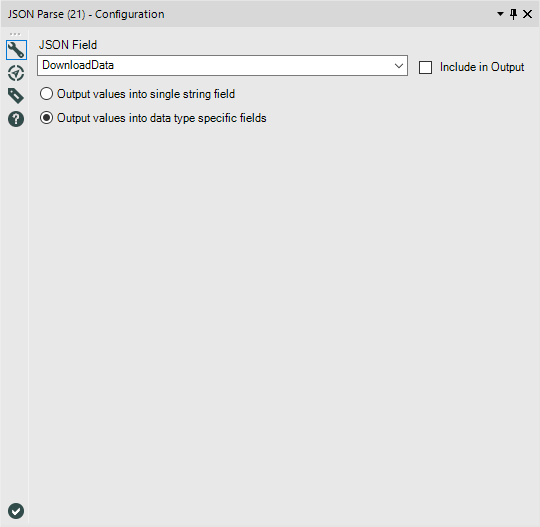 Now, if we run the workflow and have a look at it, we will see all this data in our results window:
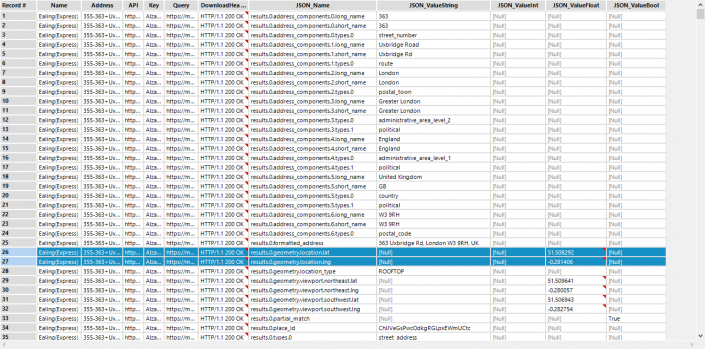 Instead of having just 1 row for each stores, not we have a lot of rows for the same store with a lot of data. The street, street number, administrative levels, postcode, etc. But highlighted in blue are the fields that are more important for us: the latitude and longitude. We are not interested in the other fields, and that's why we are using the next Filter tool, to keep just the rows with the latitude and longitude of each store. So we add the next expression in the Filter configuration: [JSON_Name] = 'results.0.geometry.location.lat' or [JSON_Name] = 'results.0.geometry.location.lng' to keep just rows with those two values in the JSON_Name field. Now we only have 2 records per store.
Cross Tab, Select and Create Points
Three last tools of the workflow to reshape the data in a more useful and meaningful way.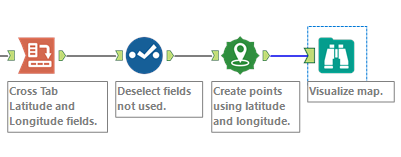 Cross Tab allows as to pivot the orientation of the data in our table. So we are going to group the data by the Name of the store, the Address and the fields with the Query and the Key (these last ones just in case we want to keep to have a quick check before deselecting them), select the JSON_Name field as the New Column Header and the average of JSON_ValueFloat as the Values for New Columns. In this case we choose the average to avoid summing the lat and long in case there is any duplicate stores that we haven't noticed before.
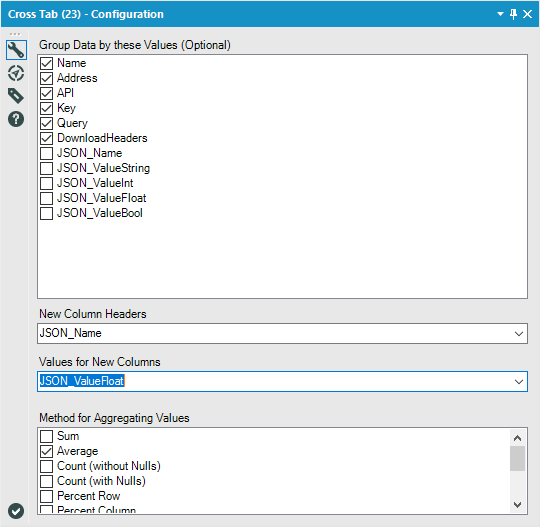 Now we just use the select tool to deselect all the fields that we don't want to keep and change the name of the ones we are keeping. And this is what we get:
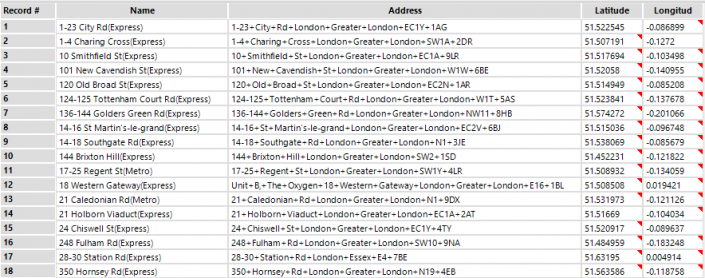 We could output the data to a .tde to start visualizing it in Tableau, but instead I decided to use the Create Points tool, so we can use the location of each store in Alteryx for any additional analysis that we want. Now we could, for instance, input a second file with all our customer data and analyze the frequency of visits based on the distance to the stores, understand the profile of each store based on demographics using census data or search for future store locations based on areas of London that are actually not covered.