

23 October 2018
Back in 2016, my colleague Andy Pick created this great blog on how to use custom SQL to 'fill in' a date range, in order to effectively show metrics using a time-series chart.It's fantastic, and still works, but this year Tableau launched Tableau Prep, and I wanted to show you how we can transfer the logic shown here into a Tableau prep file, or for those of you with Alteryx, an Alteryx designer workflow.
Let's start with the problem. We run a support desk, and our tickets are logged with a start date (i.e. when the ticket was raised by the end-user), and an end date (i.e. when both the support desk agent, and the end-user decided that the problem had been resolved).We get many support desk tickets, and I want to visualise, over time, how many tickets and open at any given point in time. Well, without a mark for every date, in Tableau this is difficult to do.So we need to transform our data from looking something like this...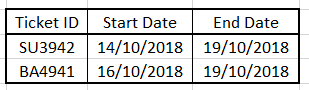 Into something that looks like this...
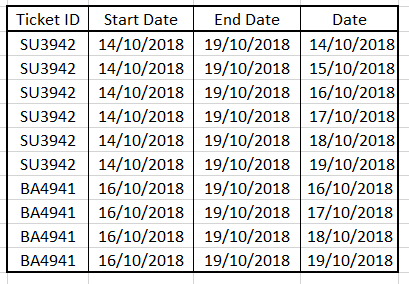
So let's start with how we can do this with Tableau prep.As with Andy's custom SQL solution, we need to do some ground work in Excel before. We need to create a single column table with every date that is possible in our range. To do this you may use Tableau desktop to understand the min start date and the max end date. You may want to extend the range into the future so that your solution is a future proof against a later end date.For the sample dataset above, my date file would look something like this...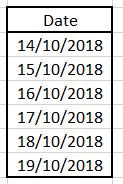 I will then save my file as a xlsx file, and refer to it as 'Date Scaffold' from this point forward.Now we can open Tableau Prep, and input our two files, out date scaffold data, and our support ticket data.The next step is to use a neat trick to append the date scaffold table, to the support tickets table. We can do this using a step, for each stream, where we create a calculated field called Append, and the value will be 'JOIN'.We will then append the datasets together, using the join tool, using the now common field in both datasets 'append'. The process itself is outlined in a blog here.With the sample data used in this post, this process will create the following table...
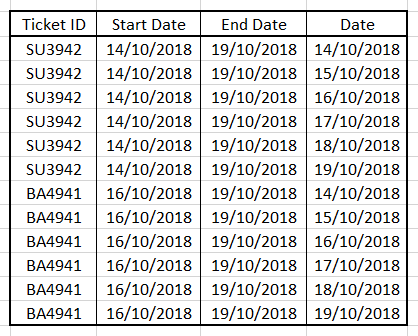 And my flow is as follows (note I have removed the 'Append' fields from both data streams in the join menu.
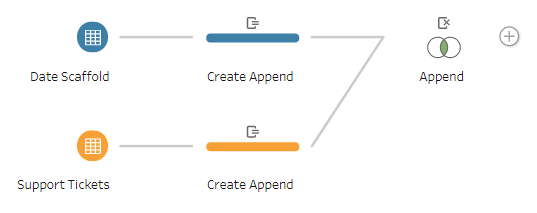 Now if you look at the data we have at this point, because we have used an append, we have every single date, against every single support ticket. To isolate just the dates that are appropriate for each support ticket, we will create a filter using the step option.The filter logic we are going to apply is fairly straight forward. We want to only keep rows where the date field is greater than or equal to the start date, and less than or equal to the end date.
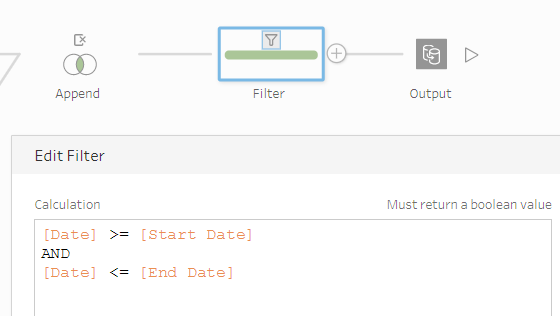 Once you have applied the filter, the next step is simply to perform any additional preparation you need to apply, before outputting your hyper file and vizzing in Tableau!You can find the sample packed Prep flow used in this post here.
Now doing this in Alteryx is amazingly simple, and we don't even need the date scaffold file; they have built a tool (generate rows), that allows you to fill in ranges, whether that be dates or numeric values.We will input our support tickets data onto the canvas, and then connect the generate rows tool to our data stream.In the configuration pane for the generate rows tool their are three key parts, firstly, your initial expression. This represents the starting value. In our case, this is our 'Start Date' field.The next important piece is the 'Condition Expression', that means, when should the tool stop generating rows. The condition in our case will be when our new date field, is greater than our end date field. We need to tell Alteryx the condition to keep looping though, so actually our statement will look something like [Date] <= [End Date].Finally we must specify our loop expression. That is, how should the date field increment for each new row. We simply want to add one day, so our loop expression will be DATETIMEADD([Date],1,'days').And with this very simple, single step process, we have achieved exactly the same result as we have with our prep flow, and this one is far more dynamic too, as there is no need to generate the date scaffold table.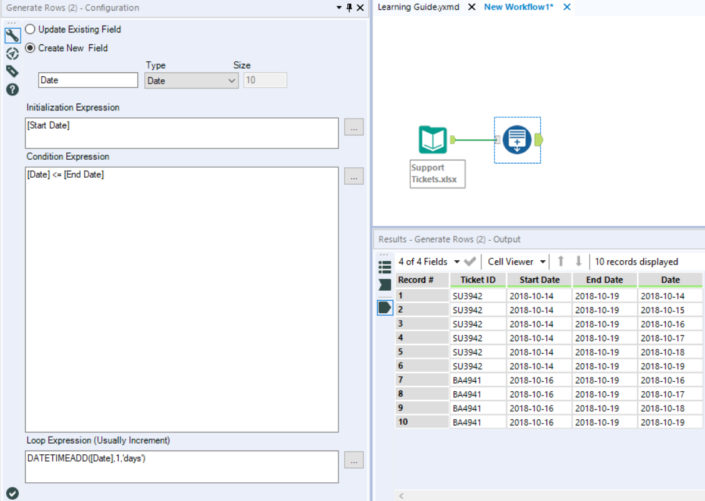 The example workflow used in this Alteryx example can be found here.I hope this post was useful, this is something I often find myself doing with our clients.Speak soon.Ben
Let's start with the problem. We run a support desk, and our tickets are logged with a start date (i.e. when the ticket was raised by the end-user), and an end date (i.e. when both the support desk agent, and the end-user decided that the problem had been resolved).We get many support desk tickets, and I want to visualise, over time, how many tickets and open at any given point in time. Well, without a mark for every date, in Tableau this is difficult to do.So we need to transform our data from looking something like this...
Into something that looks like this...So let's start with how we can do this with Tableau prep.As with Andy's custom SQL solution, we need to do some ground work in Excel before. We need to create a single column table with every date that is possible in our range. To do this you may use Tableau desktop to understand the min start date and the max end date. You may want to extend the range into the future so that your solution is a future proof against a later end date.For the sample dataset above, my date file would look something like this...
I will then save my file as a xlsx file, and refer to it as 'Date Scaffold' from this point forward.Now we can open Tableau Prep, and input our two files, out date scaffold data, and our support ticket data.The next step is to use a neat trick to append the date scaffold table, to the support tickets table. We can do this using a step, for each stream, where we create a calculated field called Append, and the value will be 'JOIN'.We will then append the datasets together, using the join tool, using the now common field in both datasets 'append'. The process itself is outlined in a blog here.With the sample data used in this post, this process will create the following table...And my flow is as follows (note I have removed the 'Append' fields from both data streams in the join menu.Now if you look at the data we have at this point, because we have used an append, we have every single date, against every single support ticket. To isolate just the dates that are appropriate for each support ticket, we will create a filter using the step option.The filter logic we are going to apply is fairly straight forward. We want to only keep rows where the date field is greater than or equal to the start date, and less than or equal to the end date.Once you have applied the filter, the next step is simply to perform any additional preparation you need to apply, before outputting your hyper file and vizzing in Tableau!You can find the sample packed Prep flow used in this post here.Now doing this in Alteryx is amazingly simple, and we don't even need the date scaffold file; they have built a tool (generate rows), that allows you to fill in ranges, whether that be dates or numeric values.We will input our support tickets data onto the canvas, and then connect the generate rows tool to our data stream.In the configuration pane for the generate rows tool their are three key parts, firstly, your initial expression. This represents the starting value. In our case, this is our 'Start Date' field.The next important piece is the 'Condition Expression', that means, when should the tool stop generating rows. The condition in our case will be when our new date field, is greater than our end date field. We need to tell Alteryx the condition to keep looping though, so actually our statement will look something like [Date] <= [End Date].Finally we must specify our loop expression. That is, how should the date field increment for each new row. We simply want to add one day, so our loop expression will be DATETIMEADD([Date],1,'days').And with this very simple, single step process, we have achieved exactly the same result as we have with our prep flow, and this one is far more dynamic too, as there is no need to generate the date scaffold table.
The example workflow used in this Alteryx example can be found here.I hope this post was useful, this is something I often find myself doing with our clients.Speak soon.Ben