


One of the most frequently asked questions I get as a consultant is “Why is my Tableau dashboard slow?”. Upon inspection of the elements that make up a dashboard and have an impact on performance, nine out of ten times the problem is a product of design. This blog series will take you through considerations to pre-empt creating slow dashboards that need fixing.
Let’s start by defining performance. In its core a well-performing dashboard fulfils three criteria: it is simple, it is maintainable and it loads fast. Let’s take a look at their significance.
A simple design allows others to use the data effectively
New and old users alike should be able to pick up a workbook and quickly answer business questions. A quick google and I can find a classic example of a complex dashboard (image obtained from thesmallman.com).

It has too many charts, it takes time to figure out and it does not have a focal point. One improvement would be to split the dashboard into multiple and have three to four visualisations per dashboard. This would give readers time to digest information and understand data. It is effective because dashboard can be kept simple.
An easy to maintain dashboard is easy to tweak
A well documented workbook has clearly labelled calculations. This means you can make modifications and handed-overs fairly quickly. Thinking of the future will save you time when building new iterations.
A responsive dashboard has fast browser load times
Every interaction, such as selecting a filter option, should display a graphical representation of data immediately. See what you need to see without watching a spinner or becoming frustrated.
Performance tools
Measuring performance in terms of simplicity and maintainability is difficult. On one hand you can do five second testing, and on the other you can work out the number of hours spent on further development work. However, dashboard load times are easy to measure and I will introduce you to the tools that help you do so.
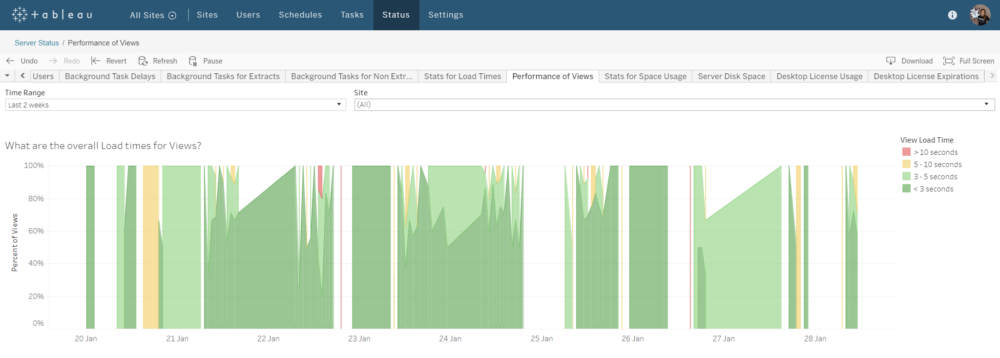
Administrative views
Navigate to Status on Tableau Server to analyse load times in a dashboard called Performance of Views exclusively available to Server Administrators or Stats for Load Times which is available to both Server and Site Administrators.
Repository inPostgres
Investigate deeper by generating custom reports using the Tableau Server repository. In addition to load times, extract live data of user interactions with reports hosted on Tableau Server, such as selecting data point on visualizations or filtering. Once you have your own performance tracking dashboard, set email alerts on slow loading dashboards when they reach higher than a ten second target.
Desktop logs
Repository logs are also created locally when a report is openedby Tableau Desktop. These logs can be read as JSON files in Tableau Desktop andused to measure performance at the query level.

Performance Recording
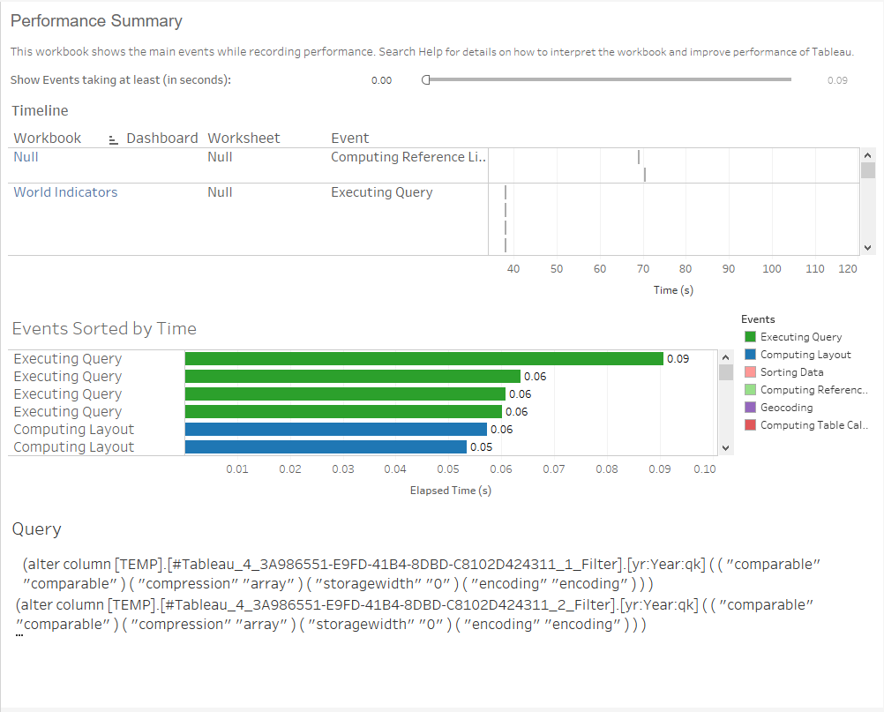
Enable performance recording on Desktopby opening a workbook and navigating to Help > Settings and Performance > Start Performance Recording. Interact as end-user(i.e make selections and filter) and press ‘Stop Performance Recording’ to makeperformance report on the spot.
On Tableau Server it works slightly different, an administrator must first enable performance recordings. This is found in Settings, under Workbook Performance Metrics, select Record workbook performance metrics and Save these changes. Any user can now paste :record_performance=yes after the question mark in front of session id. The recording begins when you reload the link. To stop the recording select Performance next to the Refresh and Pause/Resume buttons in the toolbar.

The resulting report contains a Gantt chart with all interactions in chronological order and an Events chart sorted by query length. Focusing on the longest queries at the top will help you speed up the dashboard. Also, selecting a query will display it below and you can further adapt the workbook creating new metrics to meet your own performance needs.
Now that you know about the tools, test your reports for performance and share your experiences.