8 July 2013
Where to Begin?Everyone using Tableau software began somewhere, even the rarefied band of Tableau Zen Masters. That certainly applies to all of us working at The Information Lab.As such the consultants here have shared the different approaches they took to gaining their knowledge and have developed a short list of practices for accelerating the learning curve. These are activities over and above structured training classes and hands on use in the workplace (although these still represent the cornerstone of learning).There are four main activities on the list
- Continued use of training videos and materials from courses
- Downloading packaged workbooks from Tableau Public and rebuilding from scratch
- Surfing the headings in the Knowledge Base (this is initially about breadth rather than depth to understand the scope of Tableau)
- Challenging yourself to create a visualisation from scratch based on some publicly available data
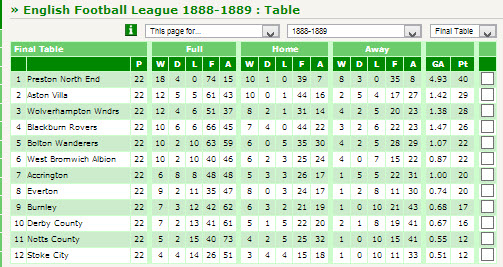
The First League Table of 1888-89
I won’t take you through a blow by blow account of building the visualisation (the packaged workbook is available for download) but I'll admit there were several times when I came close to giving up. However each time I thought that I'd hit an insurmountable challenge I always managed to find an answer either from the Knowledge Base, Tableau Community or just plain Googling it. Some of the messages from training courses I've been on also really clicked into place.Football Yes....Data NoI'm sure there are many better ways to do what I have done below in Tableau. But I think the key reason why so many people love Tableau is that great sense of satisfaction when you end up with pretty much the visualisation you had set out to achieve along with an answer to the question posed. I've shared the real world experience of a learner but I cannot imagine a non technical person achieving this with any other tool. And it only get's easier.In this case gut instinct is correct. In fact the trend becomes even starker when you start selecting the top 2 or 3 clubs as opposed to only the top club. If anyone would like access to the data set or workbook please go ahead and download it. I may create a map view to go with the data and publish that if it’s worthwhile.It would also be great to hear about the experiences of other Tableau users who use this site and let us know what you are publishing to Tableau Public. We may be able to share some of them on this site.
