

28 June 2017
Last Thursday (22nd June) I had the chance to speak at one of the most awesome meetup in London, data + women.I talked about Machine learning (ML) and how Alteryx enables any analyst to apply ML without a line of code.Here it’s a quick summary!What’s machine learning?You probably use it dozens of times a day without even knowing it.Each time you do a web search in google, machine learning works so well cause their ML software has figured how to rank web pages.When FB or apple photos tagging applications recognise your friend in your picture, that’s also ML.Each time you read your email and a SPAM filter saves you from having tonnes of spam email is again because your computer has learn to distinguish between spam and not spam email.Also in my master degree thesis I did ML as I tried to show that some variables could influence the probability of being accused of financial fraud for Italian public companies. One of these variables was the membership of university professors of business, finance or law that left the board of directors before a financial fraud was discovered. My assumption was they have the expertise to see if it’s the case to better run away.Let’s give two definitions here: 4. Understand human learning (brain, real AI)We want to study these human brain networks and understand their function like motoric, vision and so on…In a nutshell we use machine learning to understand how the brain works.Machine Learning AlgorithmsSupervised Learning: you are going to teach the pc how to do something.Unsupervised learning: we let it do it by itself.What’s supervised learning?In supervised learning, we are given a data set that already know what our correct output should look like, having the idea that there is a relationship between the input and the output.Supervised learning problems are categorized into 'regression' and 'classification' problems. In a regression problem, we are trying to predict results within a continuous output, meaning that we are trying to map input variables to some continuous function. In a classification problem, we are instead trying to predict results in a discrete output. In other words, we are trying to map input variables into discrete categories.Regression problem exampleGiven data about the size of houses on the real estate market, try to predict their price. Price as a function of size is a continuous output, so this is a regression problem.Let’s take the housing prices with different sizes (and different prices). A friend of mine wants to sell his house that is 1340 feet^2 and he wants to know the approximate value of it.The idea is that you plot a line that best fits the data and based on that I can tell my friend that the house is worth 370k. This is an example of supervised learning and regression problem.More formally, in supervised learning we have a data set called training set with the house prices and sizes. From this dataset I want to learn how to predict the house prices.m = the number of training examples (number of rows) x = inputy = output(x,y) = one training example (one single row)The function is predicting the value of y, given the value of x.This model is called linear regression.
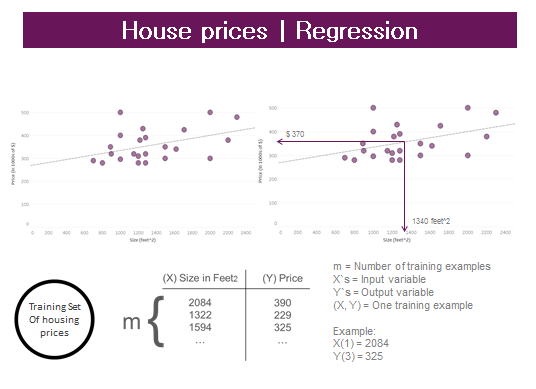 For more examples about regression click here.Classification problem example – binary outputWhat were the most important factors to survive at the Titanic disaster?All my generation can’t forget about Titanic interpretation of Di Caprio, shaking in the middle of the ice, but we also remember that if you had a ticket of first class and if you were a woman or a child, your chance were much higher to get inside one of the few lifeboats.I got my dataset from Kaggle, and I run my method in Alteryx.We are going to speak about Alteryx and its predictive tools at the end, now I just want to give you an idea about ML independently from any software and explain why Alteryx works so well for me.So here we don’t have a regression problem as we are not trying to predict a continuous variable, but instead we have a classification problem as we are trying to predict a probability of YES and a probability of NO (in supervised learning we have a data set called training set with the YES/NO responses and the other variables. From this dataset I want to learn how to predict the YES/NO answers).This is the description of my variables of interest (or predictors, my assumption is that these factors had an impact on the probability to survive):
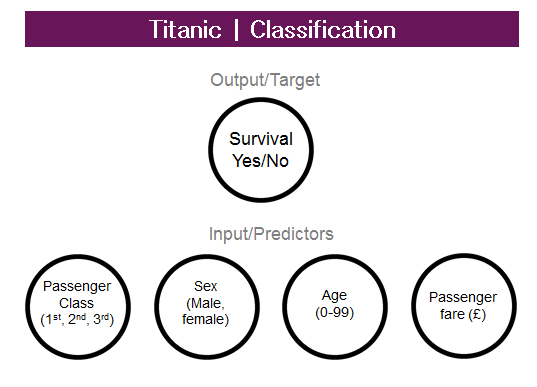 Now a sample must be created with the sample tool as you want to train the predictive models on a subset of data (estimation sample) and validate the models on another subset (validation sample). Anything not categorized in these two gets to the Holdout sample.Logistic Regression tool, Boosted model and Forest model: class of machine learning methods that predict a target variable using one or more variables that are expected to have an influence on the target variable.How do I decide which one is the best? Lift chart tool: it’s a graphical tool that indicates the relative predictive power of different binary classification models.Now I can add my test dataset (a new dataset with all predictors but without the target variable) and through the model algorithm I calculate the probability of YES/NO for each person/row.Are we predicting YES or NO? Nope, we are predicting the probability to be YES or NO (has to be 100% total) .
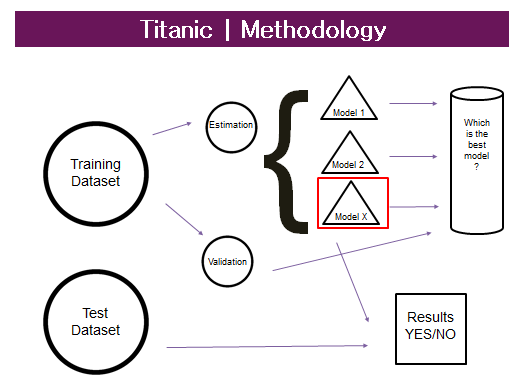 My results say that 77% of women survived against 17% of man only… On the other hand only 23% of women died against 83% of man. Now let’s have a look at age as well and see that for women probability of YES is always high whereas for men, just when they are children have a real high probability of survive.Last, women of fist class were definitely likely to survive and not die, not the same for man still dying but not like 3rd class where your chances were really few.
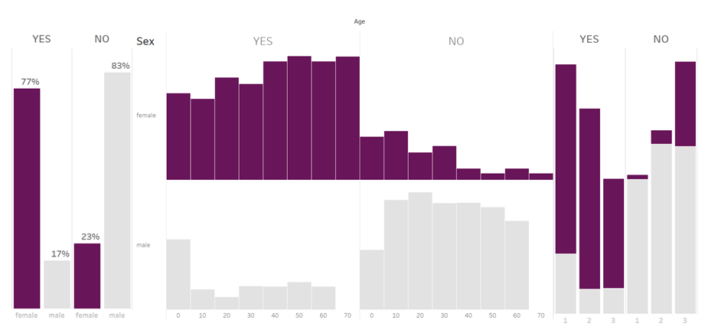 For more details about Titanic classification problem click here.Next example, still classification but not binary (YES/NO) variable.Classification problem example – not binary outputWe will predict how popular an apartment rental listing is based on some variables like number of bedrooms/bathrooms, price, etc.The target variable, ‘interest level’, is defined by the number of inquiries a listing has in the duration that the listing was live on the site. In other words, an apartment can be classified as low, medium or large interest.What we are going to predict here is a probability to fall in one of these three variables, in other words it’s a classification problem. But in this case we don’t have only YES/NO but also a third variable: HIGH MEDIUM AND LOW. The probability now will be spread into these three categories.
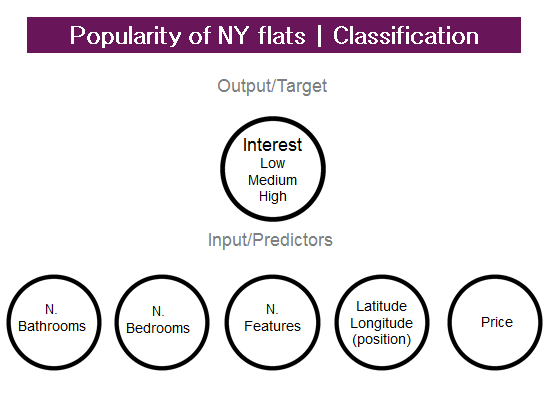 We are classifying a NYC flat popularity based on number of bathroom, bedroom, price…. Also, I have a variable that list all features bellowing to that flat. If I just count them I can get a new variable (count of feature).But as I love travelling and I like to go in Airbnb’s accommodations, what’s one of the most important things in a city?POSITION is a key variable for me. If I have latitude and longitude, I can use a good central point of NY (Time Square is central enough?) and some spatial analysis in Alteryx and get the distance from that point, so I can have a new variable like distance in miles.The methodology is the same but as our target variable isn’t binary this time, we need another method to choose our best model; in fact we will pick the model with the smallest error.What I mean is that for each record we of our training set, we will have the right response, low/medium/high and a percentage distributed among these 3 possible results. If I convert the variable with the highest probability to 1 and the rest to 0, I can sum all 1 if the highest % is attributed to the variable of interest that it’s also the right answer (e.g. Flat #1 is high interest, my predicted % are 20% LOW, 30% MEDIUM, 50% HIGH, I convert HIGH =1 and count 1 as the true answer for flat #1 is high).With this method, we are able to choose the model with the small error or in other words the one that best predict the right answer.Once we chose the model we will run it with the test dataset (with all characteristics but not the answers) and we predict the variable of interest.For more details about NYC flats classification problem click here.What’s unsupervised learning?Here we're given the data set and we're not told what to do with it and we're not told what each data point is. Instead we're just told, here is a data set. Can you find some structure in the data?In unsupervised learning we speak about clustering that it’s like a grouping method with more than one variable.One really good example of clustering is Google news.What Google News does is everyday it goes and looks at tens of thousands or hundreds of thousands of new stories on the web and it groups them into cohesive news stories. So what Google News has done is look for tens of thousands of news stories and automatically cluster them together. So, the news stories that are all about the same topic get displayed together.So what’s clustering? It’s a predictive grouping method; imagine you are Tesco and those are some of your customers, if I want to group them by Sales, what do you do?You will probably sort all customers by value and then set some ranges.But what if you have more than one variable like value and recency here? Then your grouping will be based on the best match within all those variables.
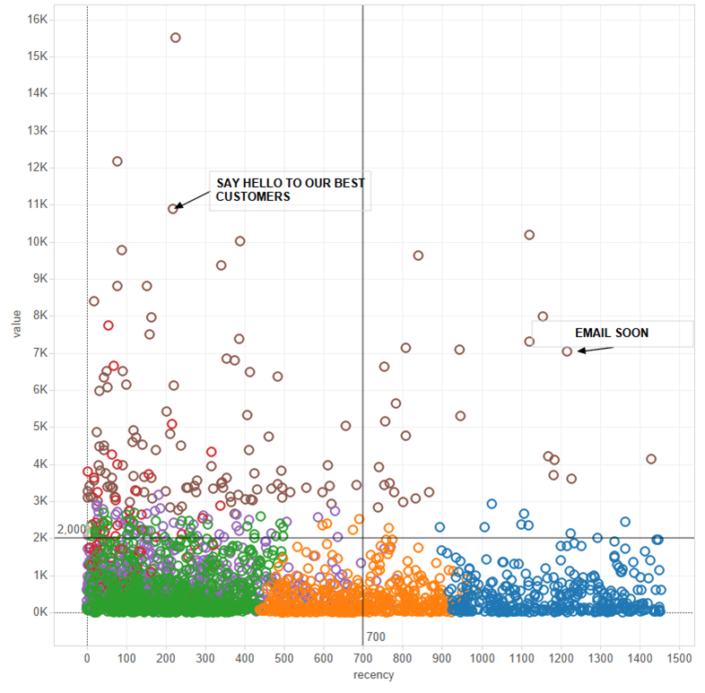 Why do we do cluster in general? We want to find similarities to optimise efforts, focus efforts, investments, etc.In cluster analysis we want to minimize the sum of distances WITHIN a cluster while maximize the distances ACROSS clusters.Let’s imagine you are a pub owner and you need to decide what beers to buy for your new place. Your customers are really diversified and you want to make sure to have a good variety.What are your measures here:
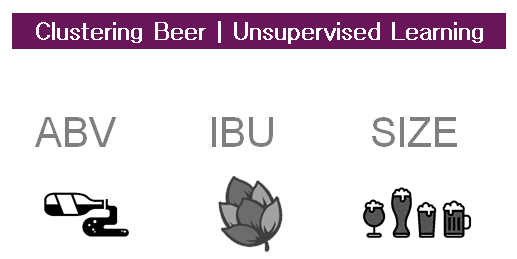 Alcohol, bitterness and size.So what do I get it’s the creation of clusters based on the best combination between these 3 measures that minimise the distance within the cluster and maximise the distance (mean, median or neural gas) between clusters.
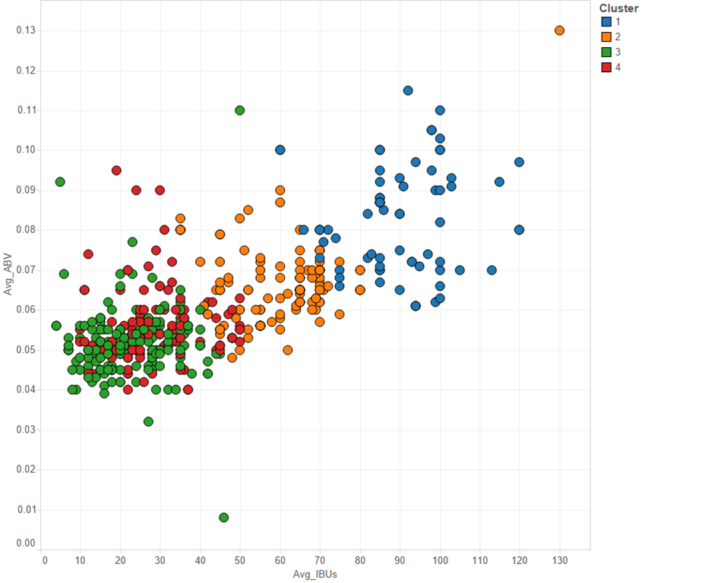 For more examples about clustering click here.Machine learning with AlteryxThis is the definition that Alteryx gives about predictive analytics.Alteryx Analytics makes predictive analytics tools accessible to users of all types and skillset.These tools are built upon the R framework through a drag and drop tool, eliminating the need for programming and scripting.What do I add to that?
- 'ML it’s a science of getting computers to learn, without being explicitly programmed'. (Arthur Samuel 1959).
- Machine learning automates algorithms that interactively learn from data and it allows computers to find hidden insights without being explicitly programmed where to look. The iterative aspect of machine learning is important because as models are exposed to new data, they are able to independently adapt.
- Data mining – computers now are able to collect large datasets from growth of automation/web.
- Application can’t program by hand
- Self-customizing programs
4. Understand human learning (brain, real AI)We want to study these human brain networks and understand their function like motoric, vision and so on…In a nutshell we use machine learning to understand how the brain works.Machine Learning AlgorithmsSupervised Learning: you are going to teach the pc how to do something.Unsupervised learning: we let it do it by itself.What’s supervised learning?In supervised learning, we are given a data set that already know what our correct output should look like, having the idea that there is a relationship between the input and the output.Supervised learning problems are categorized into 'regression' and 'classification' problems. In a regression problem, we are trying to predict results within a continuous output, meaning that we are trying to map input variables to some continuous function. In a classification problem, we are instead trying to predict results in a discrete output. In other words, we are trying to map input variables into discrete categories.Regression problem exampleGiven data about the size of houses on the real estate market, try to predict their price. Price as a function of size is a continuous output, so this is a regression problem.Let’s take the housing prices with different sizes (and different prices). A friend of mine wants to sell his house that is 1340 feet^2 and he wants to know the approximate value of it.The idea is that you plot a line that best fits the data and based on that I can tell my friend that the house is worth 370k. This is an example of supervised learning and regression problem.More formally, in supervised learning we have a data set called training set with the house prices and sizes. From this dataset I want to learn how to predict the house prices.m = the number of training examples (number of rows) x = inputy = output(x,y) = one training example (one single row)The function is predicting the value of y, given the value of x.This model is called linear regression.For more examples about regression click here.Classification problem example – binary outputWhat were the most important factors to survive at the Titanic disaster?All my generation can’t forget about Titanic interpretation of Di Caprio, shaking in the middle of the ice, but we also remember that if you had a ticket of first class and if you were a woman or a child, your chance were much higher to get inside one of the few lifeboats.I got my dataset from Kaggle, and I run my method in Alteryx.We are going to speak about Alteryx and its predictive tools at the end, now I just want to give you an idea about ML independently from any software and explain why Alteryx works so well for me.So here we don’t have a regression problem as we are not trying to predict a continuous variable, but instead we have a classification problem as we are trying to predict a probability of YES and a probability of NO (in supervised learning we have a data set called training set with the YES/NO responses and the other variables. From this dataset I want to learn how to predict the YES/NO answers).This is the description of my variables of interest (or predictors, my assumption is that these factors had an impact on the probability to survive):Now a sample must be created with the sample tool as you want to train the predictive models on a subset of data (estimation sample) and validate the models on another subset (validation sample). Anything not categorized in these two gets to the Holdout sample.Logistic Regression tool, Boosted model and Forest model: class of machine learning methods that predict a target variable using one or more variables that are expected to have an influence on the target variable.How do I decide which one is the best? Lift chart tool: it’s a graphical tool that indicates the relative predictive power of different binary classification models.Now I can add my test dataset (a new dataset with all predictors but without the target variable) and through the model algorithm I calculate the probability of YES/NO for each person/row.Are we predicting YES or NO? Nope, we are predicting the probability to be YES or NO (has to be 100% total) .My results say that 77% of women survived against 17% of man only… On the other hand only 23% of women died against 83% of man. Now let’s have a look at age as well and see that for women probability of YES is always high whereas for men, just when they are children have a real high probability of survive.Last, women of fist class were definitely likely to survive and not die, not the same for man still dying but not like 3rd class where your chances were really few.For more details about Titanic classification problem click here.Next example, still classification but not binary (YES/NO) variable.Classification problem example – not binary outputWe will predict how popular an apartment rental listing is based on some variables like number of bedrooms/bathrooms, price, etc.The target variable, ‘interest level’, is defined by the number of inquiries a listing has in the duration that the listing was live on the site. In other words, an apartment can be classified as low, medium or large interest.What we are going to predict here is a probability to fall in one of these three variables, in other words it’s a classification problem. But in this case we don’t have only YES/NO but also a third variable: HIGH MEDIUM AND LOW. The probability now will be spread into these three categories.We are classifying a NYC flat popularity based on number of bathroom, bedroom, price…. Also, I have a variable that list all features bellowing to that flat. If I just count them I can get a new variable (count of feature).But as I love travelling and I like to go in Airbnb’s accommodations, what’s one of the most important things in a city?POSITION is a key variable for me. If I have latitude and longitude, I can use a good central point of NY (Time Square is central enough?) and some spatial analysis in Alteryx and get the distance from that point, so I can have a new variable like distance in miles.The methodology is the same but as our target variable isn’t binary this time, we need another method to choose our best model; in fact we will pick the model with the smallest error.What I mean is that for each record we of our training set, we will have the right response, low/medium/high and a percentage distributed among these 3 possible results. If I convert the variable with the highest probability to 1 and the rest to 0, I can sum all 1 if the highest % is attributed to the variable of interest that it’s also the right answer (e.g. Flat #1 is high interest, my predicted % are 20% LOW, 30% MEDIUM, 50% HIGH, I convert HIGH =1 and count 1 as the true answer for flat #1 is high).With this method, we are able to choose the model with the small error or in other words the one that best predict the right answer.Once we chose the model we will run it with the test dataset (with all characteristics but not the answers) and we predict the variable of interest.For more details about NYC flats classification problem click here.What’s unsupervised learning?Here we're given the data set and we're not told what to do with it and we're not told what each data point is. Instead we're just told, here is a data set. Can you find some structure in the data?In unsupervised learning we speak about clustering that it’s like a grouping method with more than one variable.One really good example of clustering is Google news.What Google News does is everyday it goes and looks at tens of thousands or hundreds of thousands of new stories on the web and it groups them into cohesive news stories. So what Google News has done is look for tens of thousands of news stories and automatically cluster them together. So, the news stories that are all about the same topic get displayed together.So what’s clustering? It’s a predictive grouping method; imagine you are Tesco and those are some of your customers, if I want to group them by Sales, what do you do?You will probably sort all customers by value and then set some ranges.But what if you have more than one variable like value and recency here? Then your grouping will be based on the best match within all those variables.Why do we do cluster in general? We want to find similarities to optimise efforts, focus efforts, investments, etc.In cluster analysis we want to minimize the sum of distances WITHIN a cluster while maximize the distances ACROSS clusters.Let’s imagine you are a pub owner and you need to decide what beers to buy for your new place. Your customers are really diversified and you want to make sure to have a good variety.What are your measures here:Alcohol, bitterness and size.So what do I get it’s the creation of clusters based on the best combination between these 3 measures that minimise the distance within the cluster and maximise the distance (mean, median or neural gas) between clusters.For more examples about clustering click here.Machine learning with AlteryxThis is the definition that Alteryx gives about predictive analytics.Alteryx Analytics makes predictive analytics tools accessible to users of all types and skillset.These tools are built upon the R framework through a drag and drop tool, eliminating the need for programming and scripting.What do I add to that?- Alteryx gives you an overall overview of all the process/model and this really helps you for a deep understanding of the subject as you can follow along and sees all the necessary steps in order to run your prediction.
- Alteryx allows building repeatable workflows, so the same model can be used many times.
- with the integration of R in Alteryx you don’t need a line of code and this enable any single analyst to make meaningful predictions given the use of good assumptions and a basic understanding of statistics.