Quite a few months ago I’ve created a drill down map for MakeoverMonday using this dataset. After publishing the viz, quite a few people asked about how the drilldown was made.
The short version
Well, the quick secret is that I’m using two sheets in the same container but when one is visible the other one is hidden and vice versa. If that is all the information you needed than here you go, but if you would like to see the detailed step-by-step guide continue reading.
The detailed version
Step 1 - Create the maps
First we need to create two different worksheets each of them containing the two different maps.
One of them will be the zoomed out version or the base map and the second one will be what we want to see when zooming in or drilling into the view.
To build the base map we bring country into the view, add number of individuals served onto size, number of bridges on colour and format this slightly.
The second map shows the bridges for each country once a particular country is chosen. Here we have the country outline and the location where the bridges are.
As this represents two layers within the map we need to create a Dual Axis and place the bridge location on the bottom marks card. As this is recognized as one single spatial object we will need to bring bridge name onto detail to break the view up and show every bridge as an individual point. Then a bit more formatting, size based on individuals served and colour the dots based on Stage of construction.
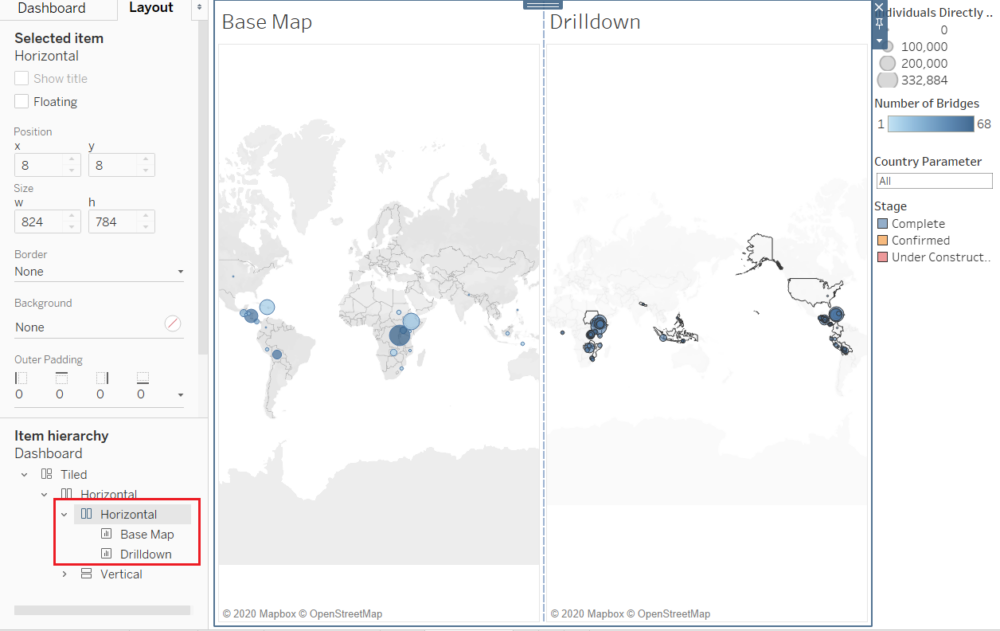
Step 2- Bringing both maps in the same container on the dashboard
Choose the horizontal container within the dashboard and then make sure to bring in the base map and the drill down next to it in the same container.
Step 3 - Setting up and configuring the parameters
So far we created the maps but now we need them to communicate with each other. To do this we will be using parameters.
We need to create the Country parameter and just so we can test it I will populate it with Haiti.
When the parameter is set to Haiti we only want to see Haiti in the Drilldown map.
But the parameter is not connected to anything, so we create a calculated field called 'Parameter Filter for Bridge Map'.
Drag this onto the filter shelf on the Drilldown sheet and tick true, meaning that we only want to see those countries where the country equals the value in the parameter, in this case Haiti.
Although the filter is now working for the Drilldown, the map is still showing for the Base map as well, which we don't really need once we selected the country.
So we need to create another calculated field that will serve as the filter for the base map called Parameter Filter for Country Map.
What this filter will do is show the Base map when the value of the parameter equals the word 'All'. Bring this onto filter and select true. As a note, you might need to manually type in the word 'All' into the parameter for that yes option to appear.
To test it, now type in a country instead of All, and you will see the base map disappear and the drilldown appear.
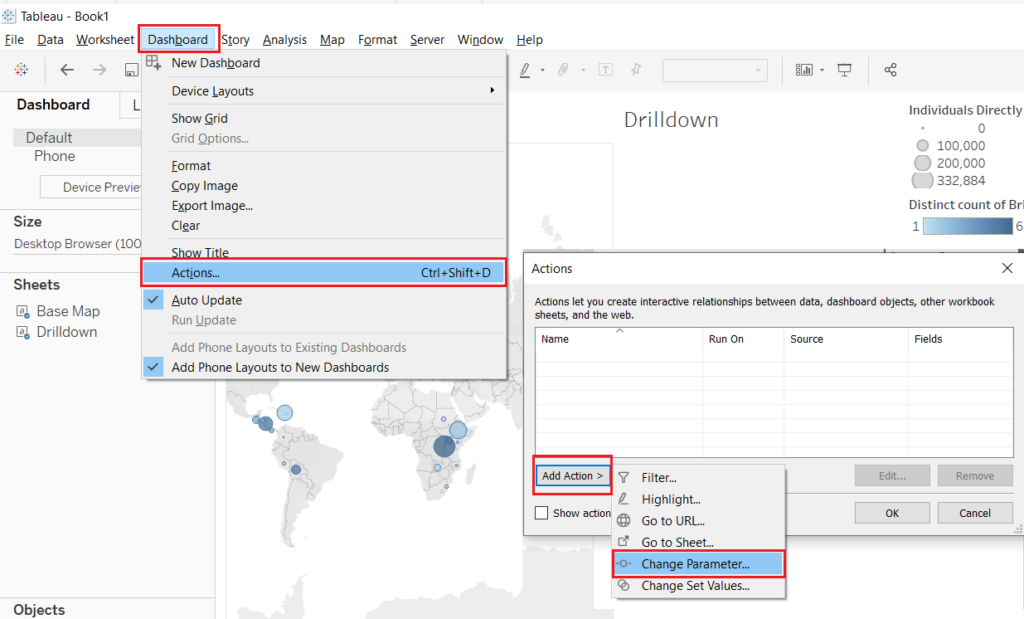
Interacting with the dashboard by typing in the country name is really clunky so instead, the parameter should update by clicking on a country in the base map. In order to do this we need to set up parameter actions on the dashboard.
When clicking on a country in the Base map the parameter will now update to show that section in the drill down.
But at this point we can only go back to the Base map by manually typing in the word 'All' into the parameter. So we need to create something that would allow us to populate the parameter at a click. We can easily achieve this by creating a new sheet.
Now to set up the parameter action for this reset button. Same as before under Dashboard → Actions → Add action → Change parameter.
So when clicking on the reset, the Base map appears and the Drilldown disappears.
Step 4 - Making the blank sheet disappear
All that’s left to do is make sure that which ever sheet is shown, it fills up the entire screen.
Hide the title so the sheet that it’s not empty will pop all the way to the right side of the container. Also make sure that Fixed with pin is unticked for both sheets, otherwise that will also stop the active map from filling the entire space in the container.
Click back and forth between the two maps creating the illusion of the drill down. Using this method to swap sheets you can keep adding more sheets in the same container adding a third or fourth layer to drill down to. Would just need to keep an eye on the filters and understand how populating the parameters will impact the view, but the logic will remain the same.
This was it, hope you enjoyed the Drilldown Map. You can find and download the workbook here. Feel free to leave any comments or ask any questions.