


I’m going to try and share some of the techniques and methods I use as a consultant. Using Tableau & Alteryx daily means that I’ve found I take small techniques, tips & tricks for granted. Hopefully this will be useful for you all.
Speaking to someone internally recently, we we looking to set a 'ranking' set-up with Tableau to work out the top 5 of a dimension per year. In this example, I'll use Tableau's trusty Superstore Sales to demonstrate the problem, and the solution I came to.
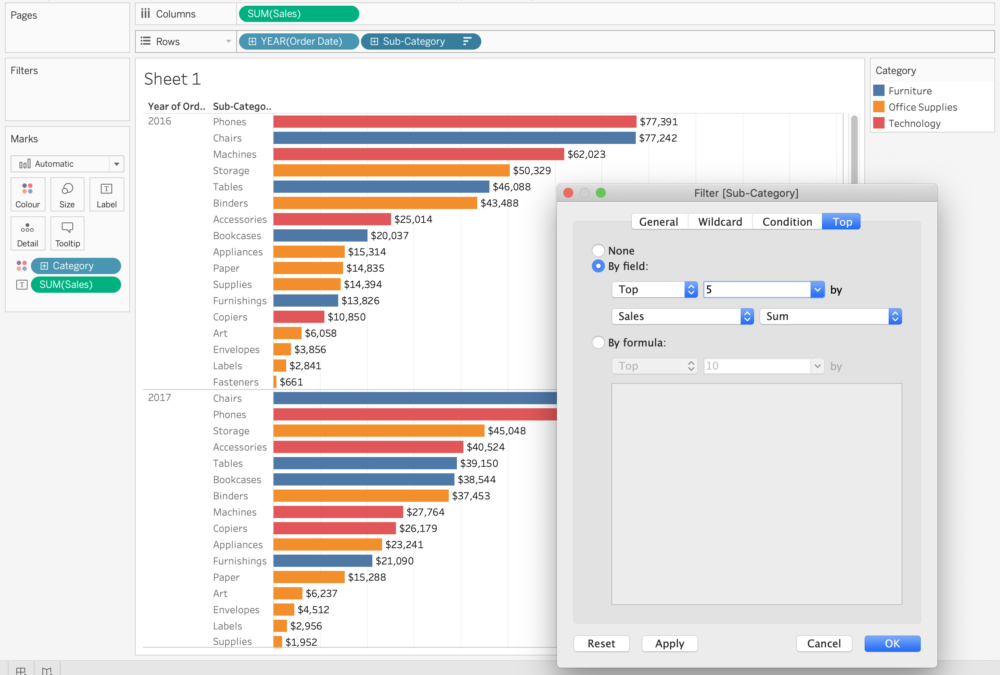
The standard way to set a top 5 filter in Tableau is to either right-click a dimension and click 'Filter' before going to the 'Top' tab and setting the field.
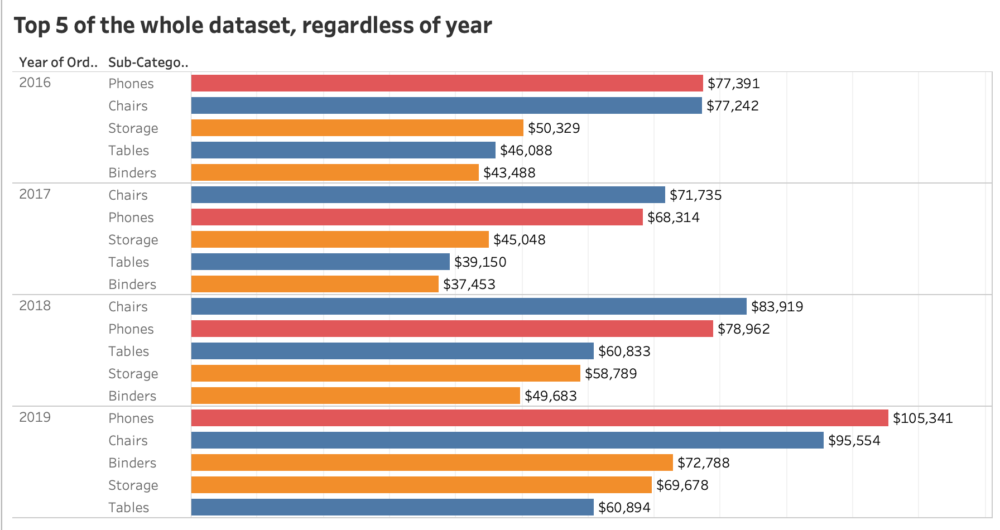
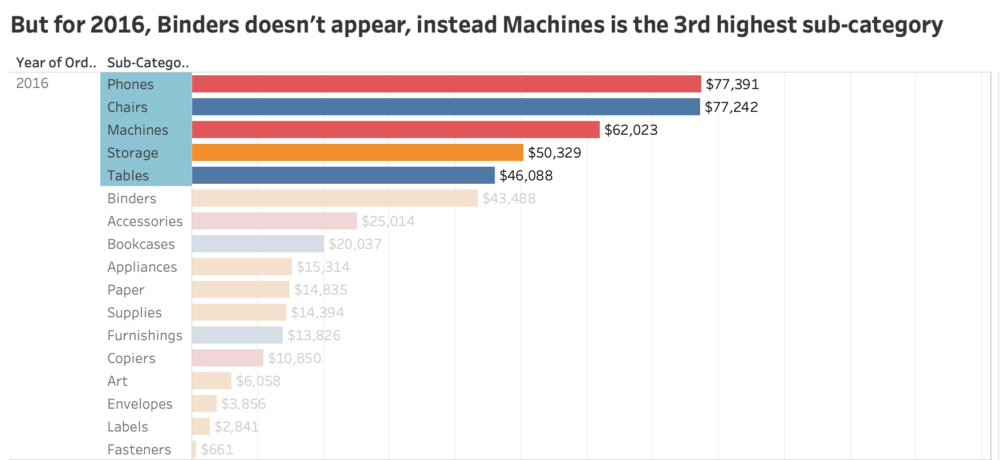
While this works at a high level (that the Sum of Sales overall in the dataset has THESE 5 subcategories as the highest), as shown above. But below, we can see, this isn't answering the question we have - that we want to see the top 5 for each year.
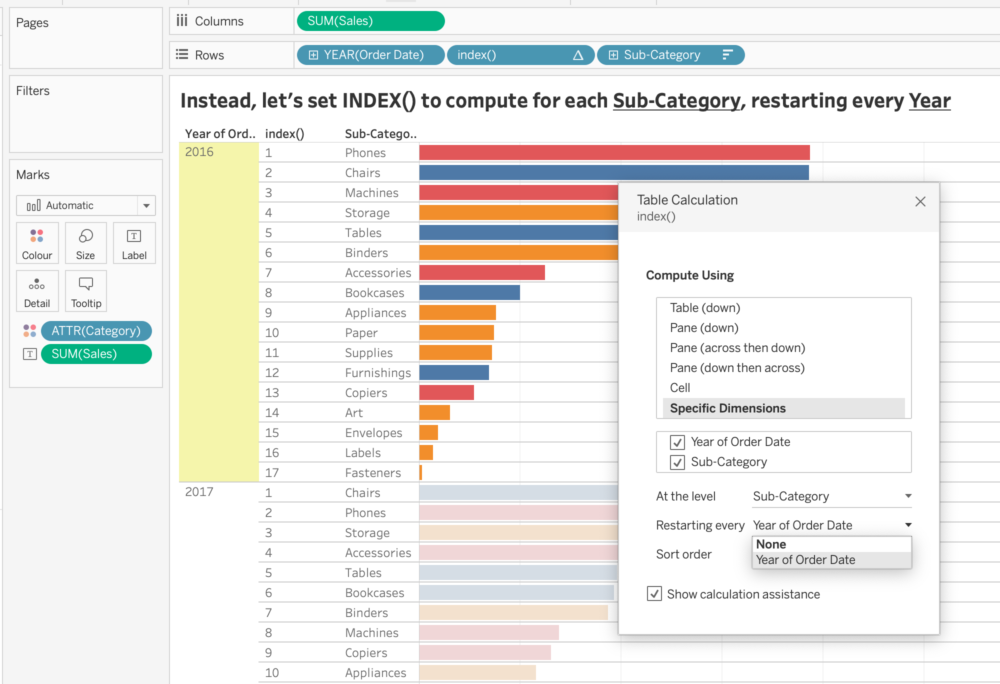
Instead, we have to use an INDEX() calculation, which we will use to rank each of these, instructing Tableau that this restarts every year.
I would use RANK() or RANK_UNIQUE() here, however, having used them in the past, I don't trust them as much as INDEX(). For those who may not know, INDEX() is a Table Calculation which simply counts and assigns a number based on your rule. So by default, it will count from top to bottom 1-infinity, as below.
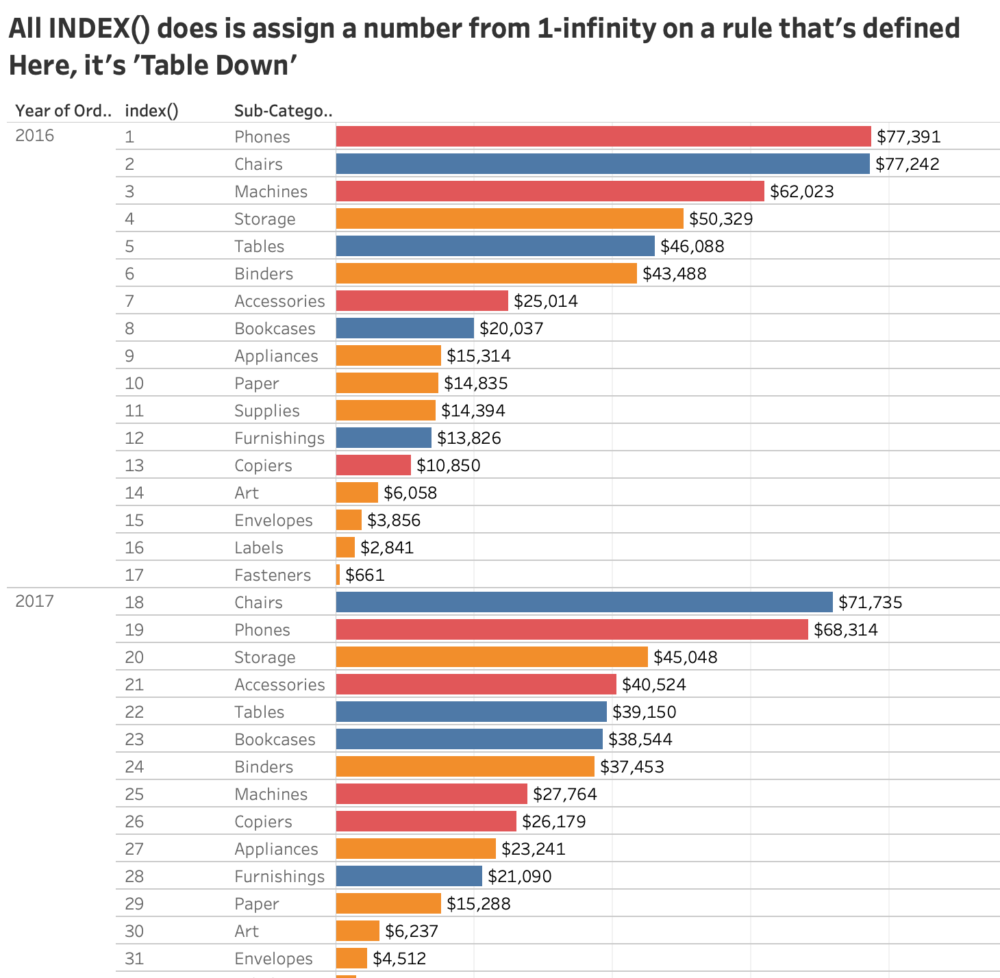
What we want to do, however, is have this restart every year - by right-clicking our INDEX() calc and editing the Table Calculation in the window as below.
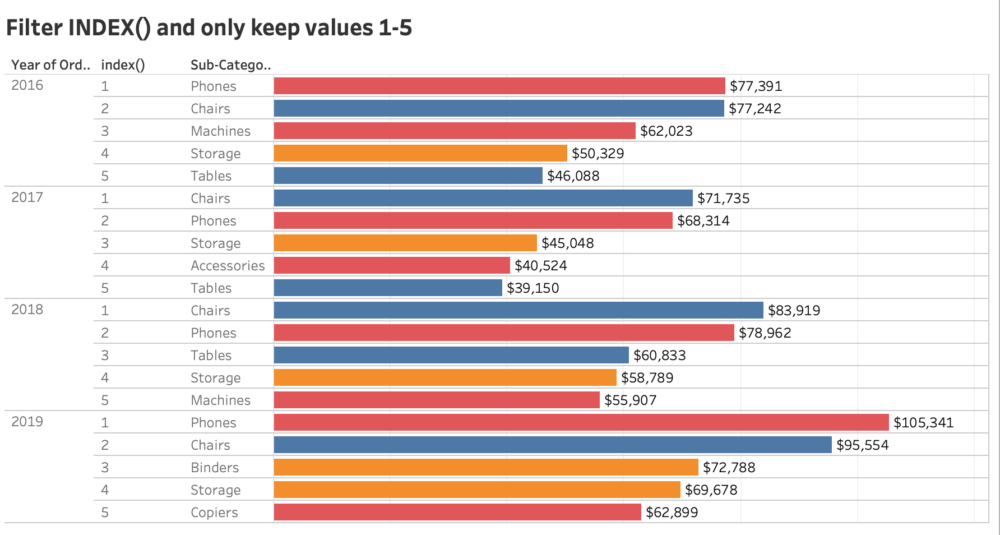
Finally, we'll filter on the top 5 using our new INDEX() field and only keep the top 5.
So this solves our problem. However, what happens if I want to see two additional things:
- Swap between the full list, and the top 5
- See the Manufacturer for each Sub-Category to understand who's inside
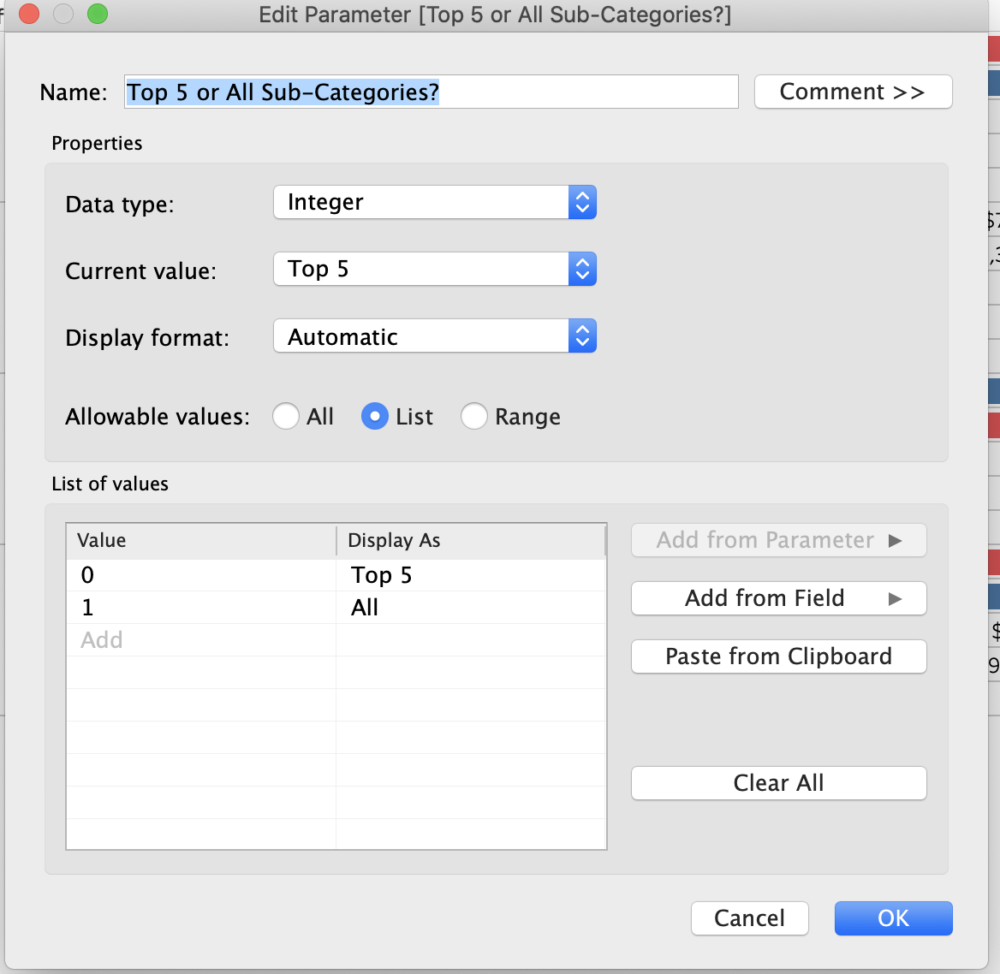
To answer question 1 - We need to create a parameter..
Then we connect this parameter to a calculated field, as below
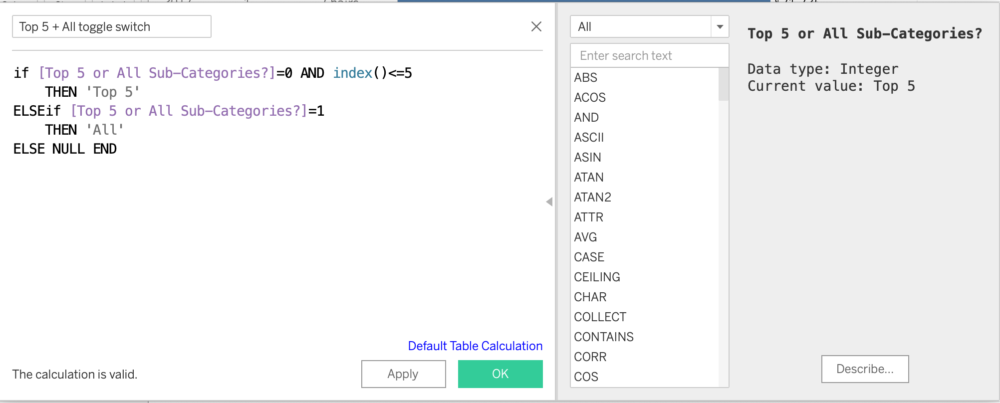
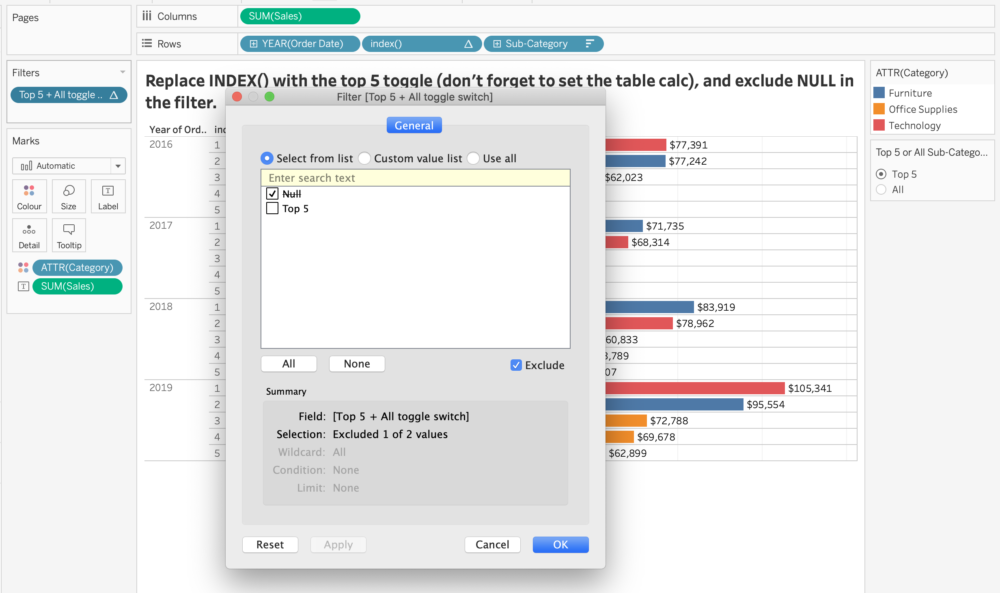
Finally, replace the INDEX() calc we had before with this new calculation, and when 'Top 5' is selected on the parameter, then make sure you 'EXCLUDE' the NULL value.
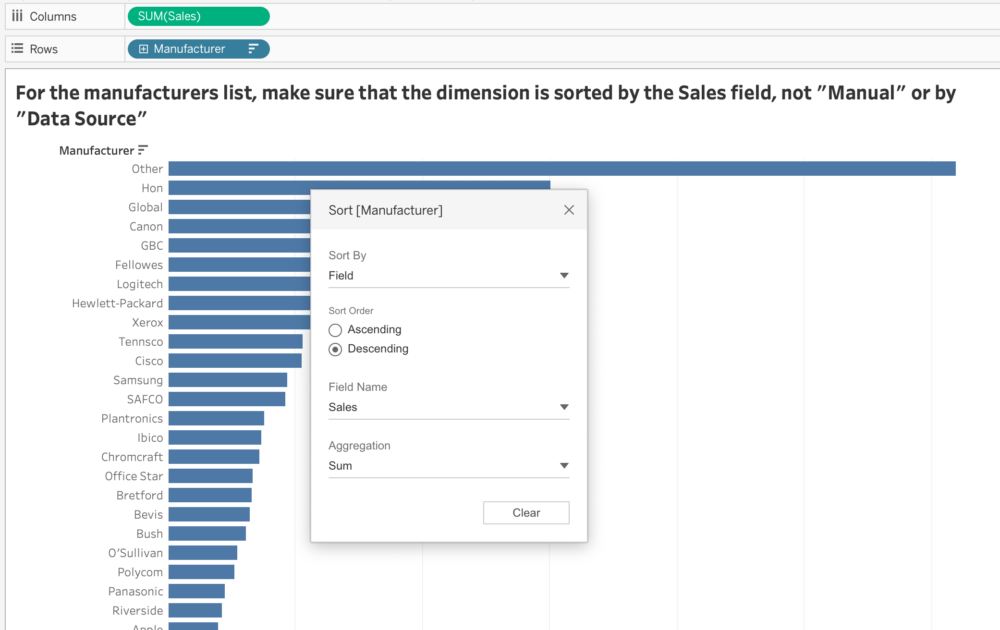
And for our 2nd question, about Manufacturers, we want to create this sheet, ensuring we've set the sort order to be by field.
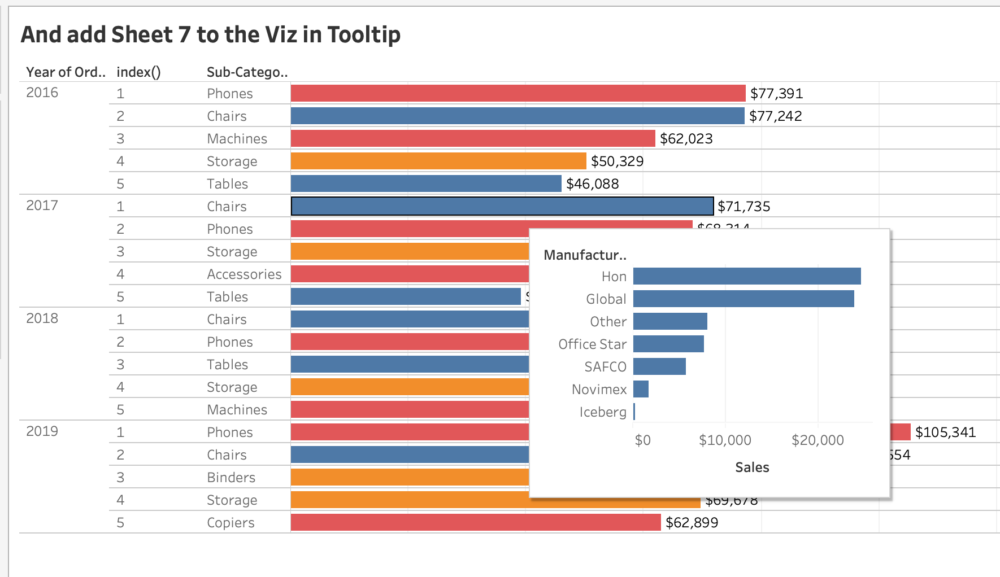
And to finish off, we can put it in the main Top 5/All bar chart as a Viz in Tooltip.
Thanks for reading!