

Why connect GA to Tableau?
Google Analytics has a whole platform that allows you to explore the data with pre-built charts or custom reports and dashboards. So why would you want to connect it to Tableau? Of course there are many different answers to this question, but I'd say the main reasons would be in order to supplement you GA data with additional data and bring it to a wider audience. If your end users are able to perform most of their analysis in Tableau Server, why would they want to have to navigate a whole additional, unfamiliar platform?
How to create the connection
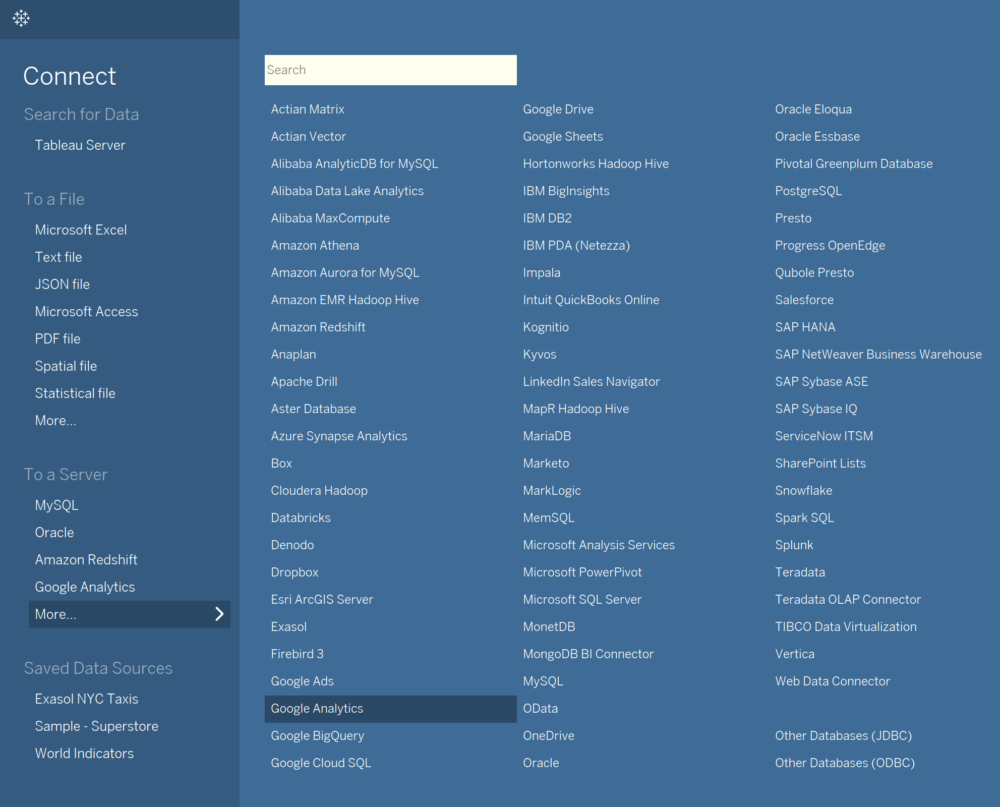
When opening Tableau Desktop, you'll find the connection to Google Analytics under the 'To a Server' menu:
You'll then be asked to authenticate through your Google Account in your internet browser. This will create the following connection in Tableau:
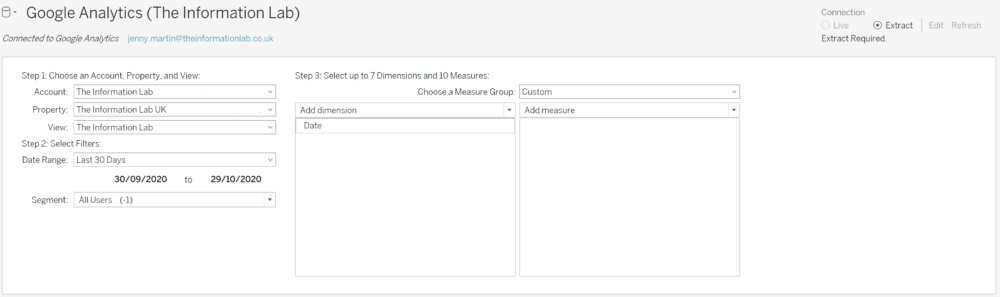
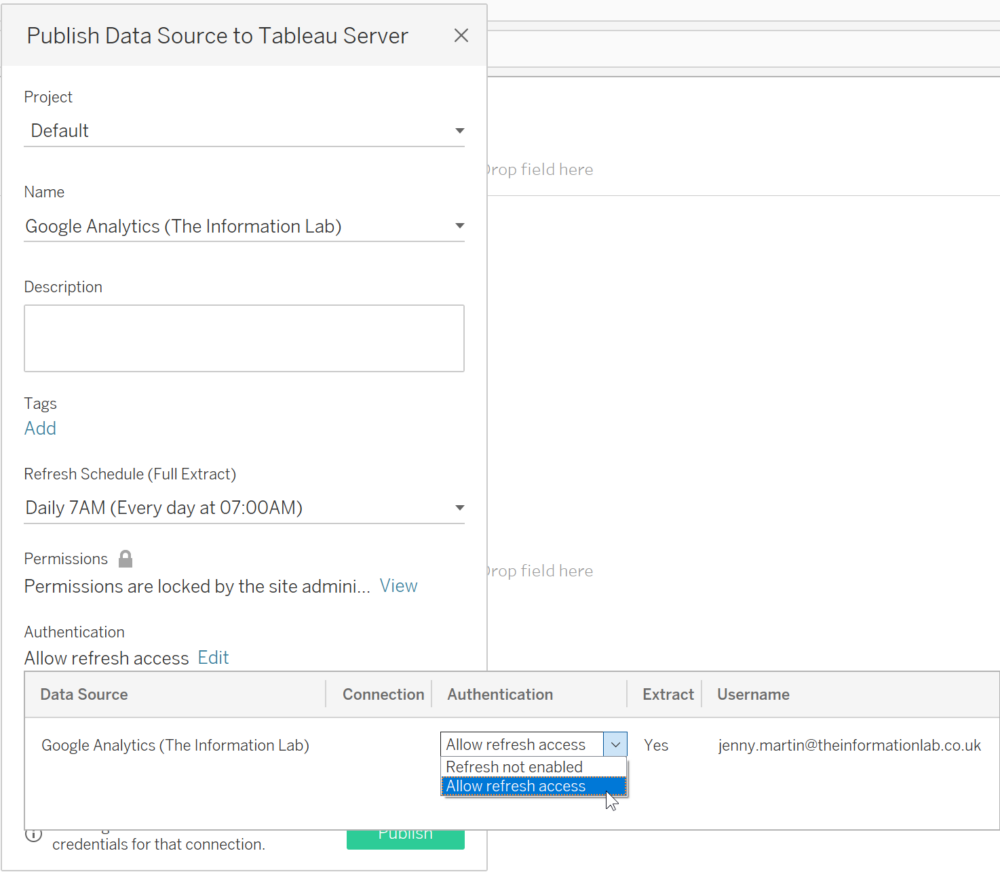
Notice how we're creating an extract rather than a live connection. Just like any other data source, we can publish this to Tableau Server and embed the credentials to keep the data in Tableau fresh:
What Dimensions and Measures will I need?
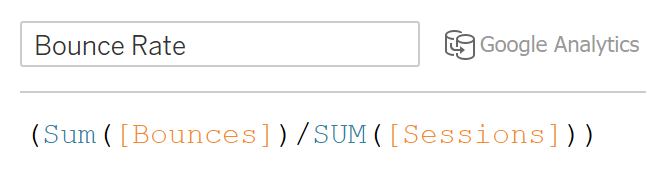
One thing you may immediately notice when searching through the measures, is that some seem to be missing when comparing to the GA platform. For example, Bounce Rate does not appear as a measure. This is an example of a measure you will need to calculate in Tableau itself, as it will depend on what dimensions are in the view you're building. There's a great resource on Tableau Community with a list of GA measures that you may need to calculate.
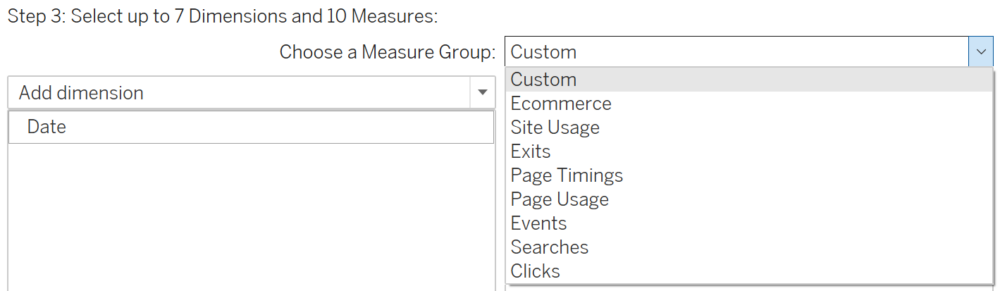
As well as this, Tableau provides certain measure group suggestions which may help you begin to explore your GA data in Tableau.
Sampling Issues
There are restrictions on the amount of data GA will allow into Tableau. By default, Tableau will attempt to bypass these restrictions with multiple queries, but sometimes only a sample of the data will be returned. Thankfully this is made very clear in the Tableau interface, and there will even be further suggestions as to how to return all the data:
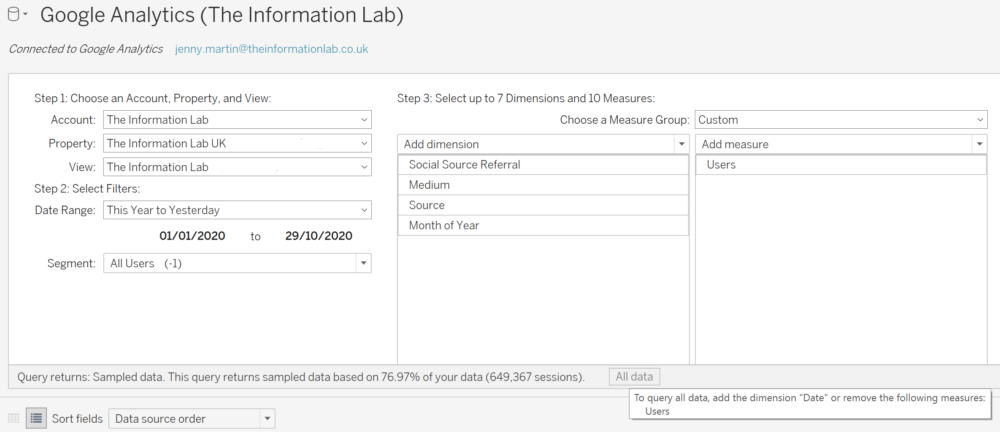
In this instance, changing the Month of Year dimension to instead be Date is enough to return all of the data. For further information on this, Tableau's own help page on Google Analytics is very useful.
Counting Unique Users
Another thing to bear in mind when connecting to GA, is that the data returned is pre-aggregated based on the dimensions you're bringing through. Furthermore, there is not a unique User ID dimension and so counting unique users can easily lead to a mismatch between what we see in Tableau and what we see in the GA platform.
To avoid this issue, remove all session or event related dimensions from the connection when using the Users measure, so that users are not double counted across these dimensions. This may mean that you will have multiple GA connections in your Tableau workbook in order to carry out all the analysis you require.
For further information on this and other potential mismatches of measures, there's a great Tableau article which provides more details.