8 November 2016
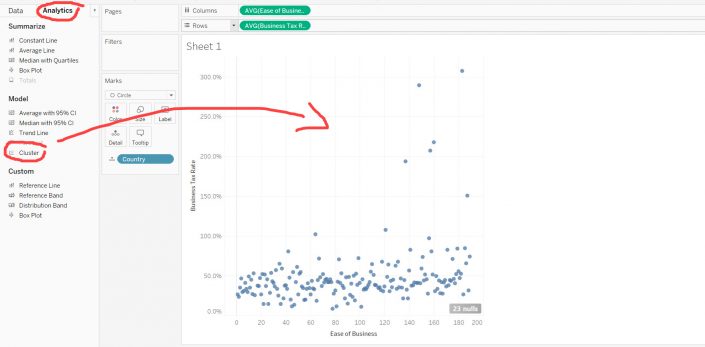
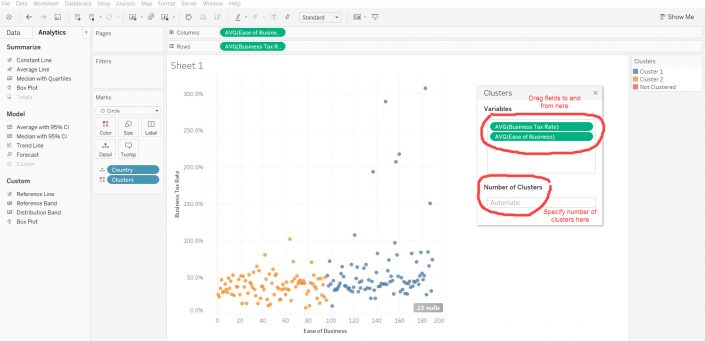
Clustering tools have been around in Alteryx for a while. You can use the cluster diagnostics tool in order to determine the ideal number of clusters run the cluster analysis to create the cluster model and then append these clusters to the original data set to mark which case is assigned to which group.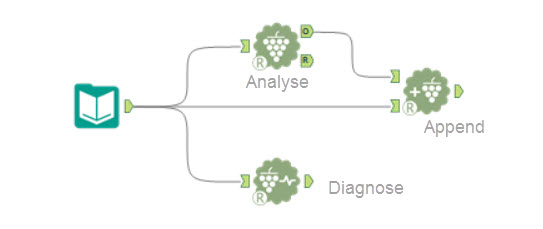 With Tableau 10 we now have the ability to create a cluster analysis directly in Tableau desktop. Just like with other analytics functions we just navigate to the analytics pane and drag and drop the cluster function to the canvas and Tableau will group our cases based on similarity. It will automatically include the measures already in the view but you can manually add or remove fields to update your clusters. Tableau will suggest an ideal number of clusters, but this can also be altered.
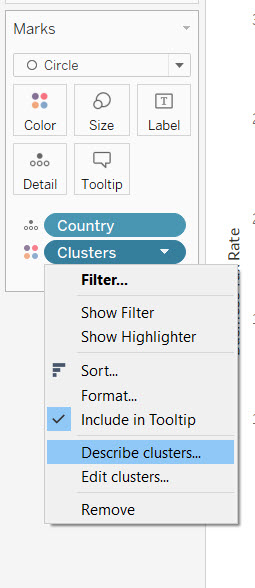
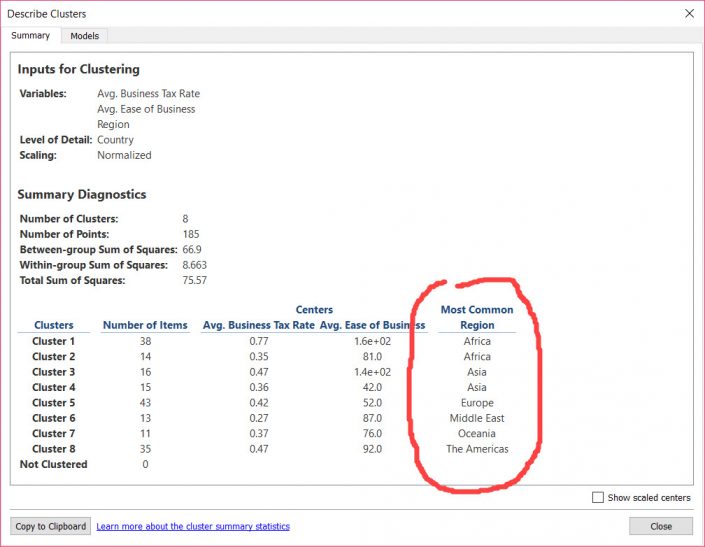
 If you have run a cluster analysis in both Tableau and Alteryx you might have noticed that Tableau allows you to include categorical variables in your cluster, while Alteryx will only let you include continuous data. What is the reason for this?The clustering methodTo understand this, we need to briefly review how the clustering method works. The goal of clustering is to group cases (e.g. customers) based on variables that the analyst has specified (e.g. number of purchases and total profit). This is done to identify those cases that are very similar to each other while trying to make the groups as different as possible from each other. This may for instance help a business save resources by targeting only certain groups of customers with a marketing campaign.Simplified, the algorithm selects a few random cases from the dataset and then starts to identify all the cases that are most similar to it, adding these to the cluster. Once that process is completed the mean of each cluster is calculated and the process starts over again, finding those cases most similar to the new mean. This process is repeated until clusters no longer change as the true mean of each group is found. This is called the K-means clustering algorithm. The same approach can also be used but rather than looking for the mean the median is determined. This is then called K-median clustering and is less susceptible to outliers. Which type you choose in Alteryx depends on how your data is structured. Tableau uses the K-means clustering approach.So if we are finding the mean of the values how do we cluster with categorical variables? What is the mean of bananas and apples? Finding the mean of two categories makes no sense. This is why Alteryx won’t let you choose anything but numerical fields as input for your cluster.So how does Tableau do this? When you cluster on a discrete field in Tableau it determines the mode of that category rather than the mean. So a cluster is defined by which category is most represented in that cluster. When you pull up the cluster description you will see that the most common category member is identified.
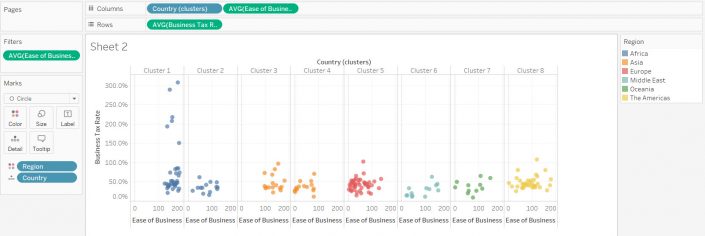
 You can further investigate this by creating a new view in which you break down your data by your clusters and colour them by the dimension you have included to see how these are distributed. A cluster might exclusively contain one category, in which case this could be meaningful. However, where do you draw the line? A cluster may contain 51% of one, and 49% of another category. Is it still meaningful to say that this cluster is well-described by category 1? In addition, if the cluster number is set to automatic, it seems to default to separating out the clusters by the categorical variable and thus exerts a high influence on the final groups.
 TakeawayBoth Alteryx and Tableau make advanced statistical modelling easy to carry out and accessible not just to statisticians. This is great, but when creating a model, such as when performing a cluster analysis, it is useful to broadly understand how the underlying technique works. This is important in order to carry it out correctly and accurately understand what the results mean.Clustering with discrete variables is possible in Tableau and can be useful in some cases. When clustering, directly in Tableau or through Alteryx, it is always good to visualise your resulting groups in a way that is useful to you and helps you understand their meaning. That way you can make sure that the segmentation is truly meaningful for your analysis.
 With Tableau 10 we now have the ability to create a cluster analysis directly in Tableau desktop. Just like with other analytics functions we just navigate to the analytics pane and drag and drop the cluster function to the canvas and Tableau will group our cases based on similarity. It will automatically include the measures already in the view but you can manually add or remove fields to update your clusters. Tableau will suggest an ideal number of clusters, but this can also be altered.
 If you have run a cluster analysis in both Tableau and Alteryx you might have noticed that Tableau allows you to include categorical variables in your cluster, while Alteryx will only let you include continuous data. What is the reason for this?The clustering methodTo understand this, we need to briefly review how the clustering method works. The goal of clustering is to group cases (e.g. customers) based on variables that the analyst has specified (e.g. number of purchases and total profit). This is done to identify those cases that are very similar to each other while trying to make the groups as different as possible from each other. This may for instance help a business save resources by targeting only certain groups of customers with a marketing campaign.Simplified, the algorithm selects a few random cases from the dataset and then starts to identify all the cases that are most similar to it, adding these to the cluster. Once that process is completed the mean of each cluster is calculated and the process starts over again, finding those cases most similar to the new mean. This process is repeated until clusters no longer change as the true mean of each group is found. This is called the K-means clustering algorithm. The same approach can also be used but rather than looking for the mean the median is determined. This is then called K-median clustering and is less susceptible to outliers. Which type you choose in Alteryx depends on how your data is structured. Tableau uses the K-means clustering approach.So if we are finding the mean of the values how do we cluster with categorical variables? What is the mean of bananas and apples? Finding the mean of two categories makes no sense. This is why Alteryx won’t let you choose anything but numerical fields as input for your cluster.So how does Tableau do this? When you cluster on a discrete field in Tableau it determines the mode of that category rather than the mean. So a cluster is defined by which category is most represented in that cluster. When you pull up the cluster description you will see that the most common category member is identified.
 You can further investigate this by creating a new view in which you break down your data by your clusters and colour them by the dimension you have included to see how these are distributed. A cluster might exclusively contain one category, in which case this could be meaningful. However, where do you draw the line? A cluster may contain 51% of one, and 49% of another category. Is it still meaningful to say that this cluster is well-described by category 1? In addition, if the cluster number is set to automatic, it seems to default to separating out the clusters by the categorical variable and thus exerts a high influence on the final groups.
 TakeawayBoth Alteryx and Tableau make advanced statistical modelling easy to carry out and accessible not just to statisticians. This is great, but when creating a model, such as when performing a cluster analysis, it is useful to broadly understand how the underlying technique works. This is important in order to carry it out correctly and accurately understand what the results mean.Clustering with discrete variables is possible in Tableau and can be useful in some cases. When clustering, directly in Tableau or through Alteryx, it is always good to visualise your resulting groups in a way that is useful to you and helps you understand their meaning. That way you can make sure that the segmentation is truly meaningful for your analysis.