

The Information Lab and TravelTime bring you location intelligence tools for retail site selection
In retail, getting insights quickly is key. Location intelligence and data-driven decision-making are crucial elements in making sure opportunities are seized. The release of the new travel time macros for Alteryx help put the right intelligence in your hands. Built by The Information Lab consultant Ben Moss for TravelTime (iGeolise), rapid insight is generated with the help of a core suite of tools:
Let's look at how these tools can be integrated into a retail site selection analysis pipeline.
To follow along at home, download the workflows here (you'll need to visit TravelTime to get a trial API key).
Building the analytics pipeline
Establishing context
- A high street store is looking to expand into new territory
- It has no existing footprint in this area
- The planning team has identified 3 potential sites based on existing infrastructure needs, ground rents, logistics considerations
- The customer team has established the core customer profile based on internally-held data (from store cards, mailing lists, online shops)
- The analytics team needs to establish which of the 3 stores gives greatest access to households fitting the core customer profile
- Access is defined by travel time. This is a much more sophisticated approach than simply defining a radial distance
Alteryx - create isochrones
- Use the latitude and longitude of the proposed stores to feed the isochrones macro (latitude and longitude can also be generated from the proposed store address using the geocoder tool)
- Specify one (or many) travel times for the isochrone (in this case 10, 15, and 20 minutes)
- Specify a mode of transport (or multiple modes)
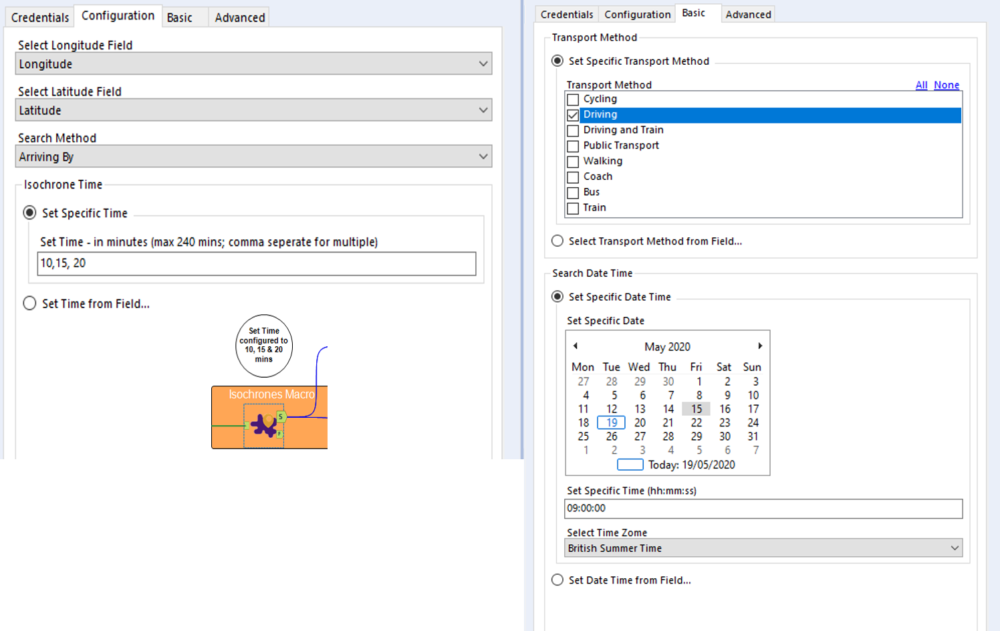
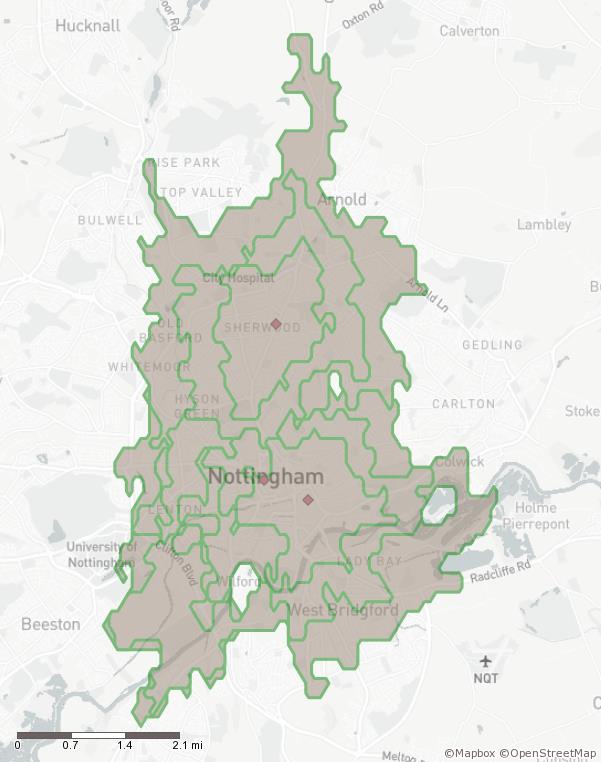
The isochrone macro creates the variable travel time polygon shapes based on the specified times as well as the conditions modelled for the day and time of travel.
Customer profile and segmentation
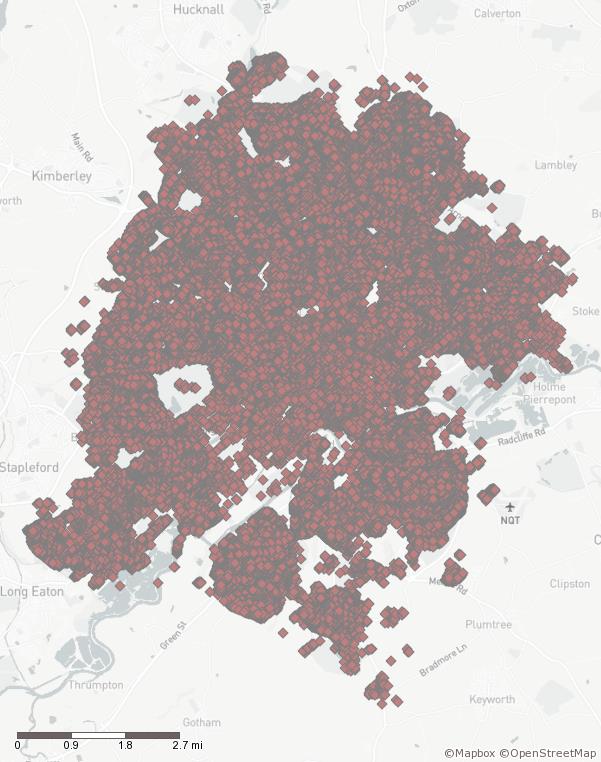
- Input household data for the new area
- Latitude and longitude has been pre-populated in this case but the geocoder tool can perform this function given an address input
- Households have been attributed with 'customer characteristic' data (either using Mosaic or an internally derived set of characteristics) to define demographics, wealth, lifestyle
- By combining the isochrone shape and the households within the shape, the target area can be analysed for suitability

Intersect with new location household data
The intersect tool from the Alteryx spatial palette allows us to siphon off only the households that fall within a particular travel time isochrone. This gives us the total number of households within our travel times of interest, and now we can establish the proportion of households that fit our required customer characteristics profile.
Completing all steps in Alteryx takes around 15 seconds.
Decision-making and Tableau
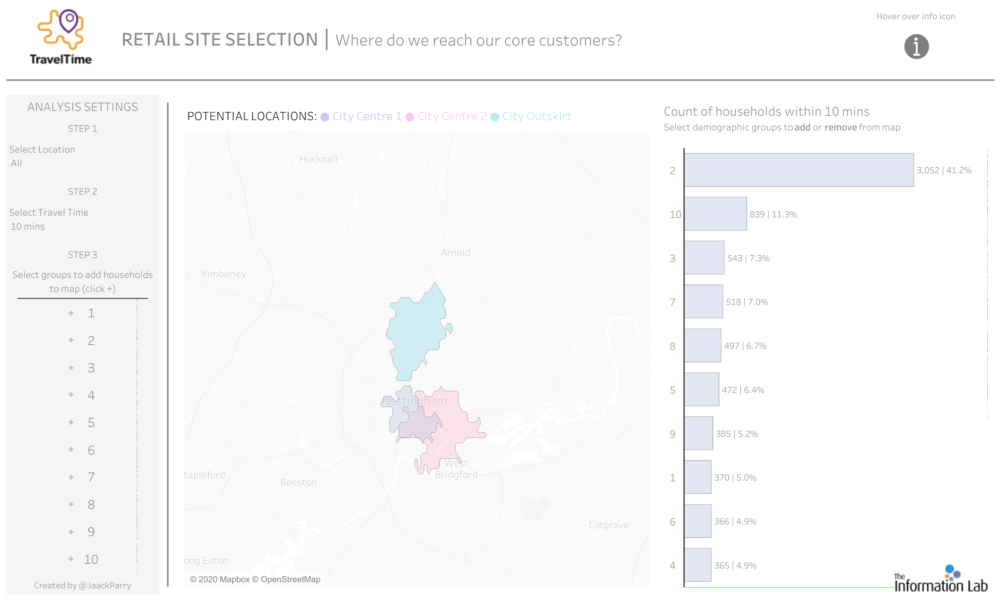
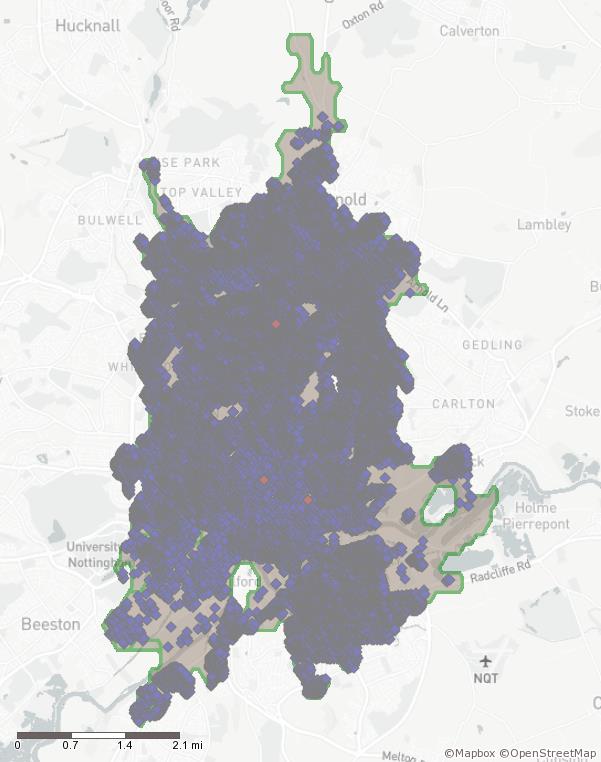
Alteryx provides an analytics team with the ability to quickly transform data from many sources into a single, consolidated output. Decision-makers need this output to be converted to easily digestible information in order to move forward; this is where Tableau excels. Here is a dashboard by Data School consultants Jack Parry and Nathan Leather to help you make decisions. Jack made use of the set controls for set actions in Tableau 2020.2 to add some outstanding interactivity to the drive-time map.
In this example, our target customer groups are:
- Mid-Career Climbers (number 2 on the dashboard)
- Urban Cool (number 7)
- Crash Pad Professionals (number 8)
With a few clicks in Tableau, we find that the proposed location on the outskirts of town gives our store greatest access to these groups within a 15 minute drive time.
Want to change the drive time limit or the target customer groups for the store? Visit the Tableau dashboard and give it a shot.
Next steps?
To download the TravelTime macros, visit the Alteryx gallery.
To get your free key to get the macros running yourself, register on the TravelTime website.
To download our sample workflows, go to this location.
Feel free to engage with me (@AdiBop_) on Twitter to talk more about the TravelTime tools or all things spatial.